Question
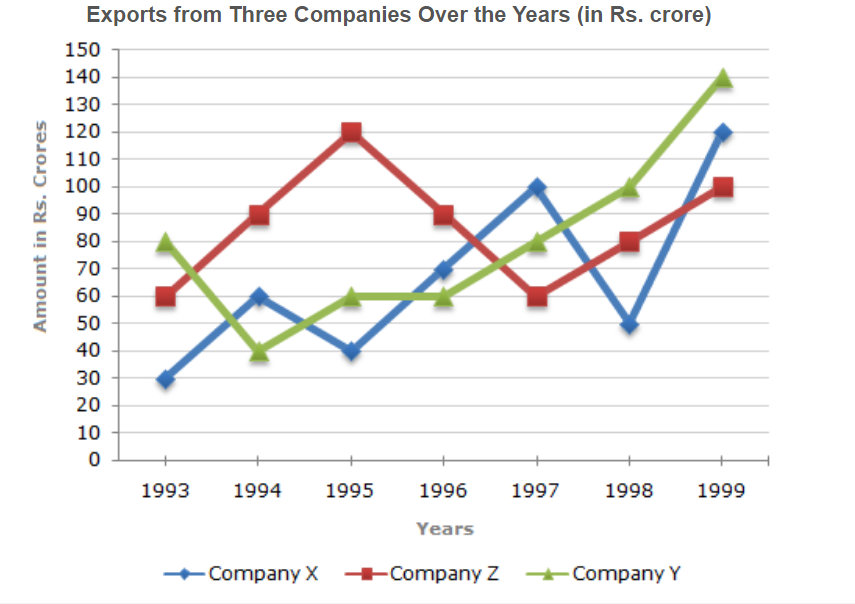
In which year was the difference between the exports from Companies X and Y the minimum?
a.
1994
b.
1995
c.
1996
d.
1997
Posted under Line Charts Data Interpretation
Interact with the Community - Share Your Thoughts
Uncertain About the Answer? Seek Clarification Here.
Understand the Explanation? Include it Here.
Q. Study the following line graph and answer the question. In which year was the difference between the exports from Companies X and Y the minimum?
Similar Questions
Explore Relevant Multiple Choice Questions (MCQs)
Q. Study the following line graph and answer the question.
What was the difference between the average exports of the three Companies in 1993 and the average exports in 1998?
View solution
Q. Study the following line graph and answer the question.
In how many of the given years, were the exports from Company Z more than the average annual exports over the given years?
View solution
Q. The following line graph gives the ratio of the amounts of imports by a company to the amount of exports from that company over the period from 1995 to 2001.
If the imports in 1998 was Rs. 250 crores and the total exports in the years 1998 and 1999 together was Rs. 500 crores, then the imports in 1999 was ?
View solution
Q. The following line graph gives the ratio of the amounts of imports by a company to the amount of exports from that company over the period from 1995 to 2001.
The imports were minimum proportionate to the exports of the company in the year ?
View solution
Q. The following line graph gives the ratio of the amounts of imports by a company to the amount of exports from that company over the period from 1995 to 2001.
What was the percentage increase in imports from 1997 to 1998 ?
View solution
Q. The following line graph gives the ratio of the amounts of imports by a company to the amount of exports from that company over the period from 1995 to 2001.
If the imports of the company in 1996 was Rs. 272 crores, the exports from the company in 1996 was ?
View solution
Q. The following line graph gives the ratio of the amounts of imports by a company to the amount of exports from that company over the period from 1995 to 2001.
In how many of the given years were the exports more than the imports ?
View solution
Q. Study the following line graph and answer the question based on it.
What is the difference between the number of vehicles manufactured by Company Y in 2000 and 2001 ?
View solution
Q. Study the following line graph and answer the question based on it.
What is the difference between the total productions of the two Companies in the given years ?
View solution
Q. Study the following line graph and answer the question based on it.
What is the average numbers of vehicles manufactured by Company X over the given period ? (rounded off to nearest integer)
View solution
Q. Study the following line graph and answer the question based on it.
In which of the following years, the difference between the productions of Companies X and Y was the maximum among the given years ?
View solution
Q. Study the following line graph and answer the question based on it.
The production of Company Y in 2000 was approximately what percent of the production of Company X in the same year ?
View solution
Q. The following line graph gives the percent profit earned by two Companies X and Y during the period 1996 - 2001.
The incomes of two Companies X and Y in 2000 were in the ratio of 3:4 respectively. What was the respective ratio of their expenditures in 2000 ?
View solution
Q. The following line graph gives the percent profit earned by two Companies X and Y during the period 1996 - 2001.
If the expenditure of Company Y in 1997 was Rs. 220 crores, what was its income in 1997 ?
View solution
Q. The following line graph gives the percent profit earned by two Companies X and Y during the period 1996 - 2001.
If the expenditures of Company X and Y in 1996 were equal and the total income of the two Companies in 1996 was Rs. 342 crores, what was the total profit of the two Companies together in 1996 ? (Profit = Income - Expenditure)
View solution
Q. The following line graph gives the percent profit earned by two Companies X and Y during the period 1996 - 2001.
The expenditure of Company X in the year 1998 was Rs. 200 crores and the income of company X in 1998 was the same as its expenditure in 2001. The income of Company X in 2001 was ?
View solution
Q. The following line graph gives the percent profit earned by two Companies X and Y during the period 1996 - 2001.
If the incomes of two Comapanies were equal in 1999, then what was the ratio of expenditure of Company X to that of Company Y in 1999 ?
View solution
Q. The following line graph gives the percentage of the number of candidates who qualified an examination out of the total number of candidates who appeared for the examination over a period of seven years from 1994 to 2000.
The difference between the percentage of candidates qualified to appeared was maximum in which of the following pairs of years?
View solution
Q. The following line graph gives the percentage of the number of candidates who qualified an examination out of the total number of candidates who appeared for the examination over a period of seven years from 1994 to 2000.
In which pair of years was the number of candidates qualified, the same?
View solution
Q. The following line graph gives the percentage of the number of candidates who qualified an examination out of the total number of candidates who appeared for the examination over a period of seven years from 1994 to 2000.
If the number of candidates qualified in 1998 was 21200, what was the number of candidates appeared in 1998?
View solution
Recommended Subjects
Are you eager to expand your knowledge beyond Data Interpretation? We've handpicked a range of related categories that you might find intriguing.
Click on the categories below to discover a wealth of MCQs and enrich your understanding of various subjects. Happy exploring!