Question
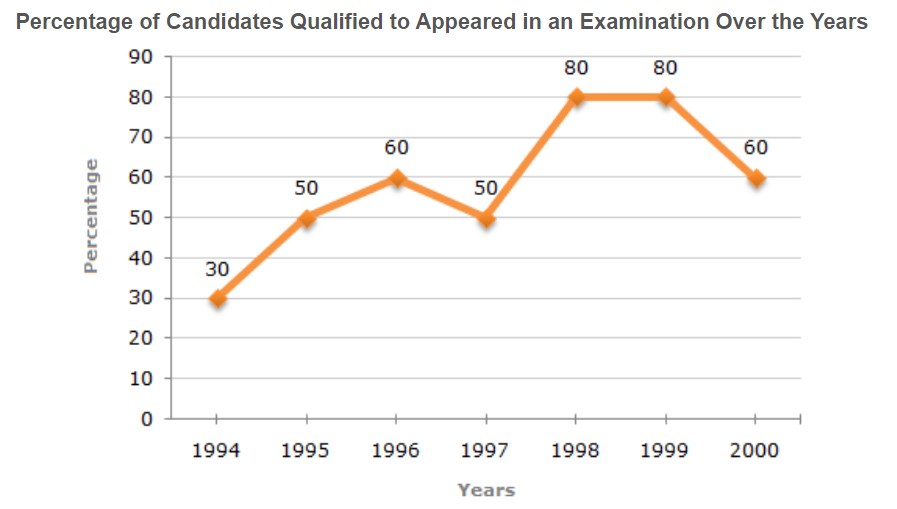
The difference between the percentage of candidates qualified to appeared was maximum in which of the following pairs of years?
a.
1994 and 1995
b.
1997 and 1998
c.
1998 and 1999
d.
1999 and 2000
Posted under Line Charts Data Interpretation
Interact with the Community - Share Your Thoughts
Uncertain About the Answer? Seek Clarification Here.
Understand the Explanation? Include it Here.
Q. The following line graph gives the percentage of the number of candidates who qualified an examination out of the total number of candidates who appeared for the examination over a...
Similar Questions
Explore Relevant Multiple Choice Questions (MCQs)
Q. The following line graph gives the percentage of the number of candidates who qualified an examination out of the total number of candidates who appeared for the examination over a period of seven years from 1994 to 2000.
In which pair of years was the number of candidates qualified, the same?
View solution
Q. The following line graph gives the percentage of the number of candidates who qualified an examination out of the total number of candidates who appeared for the examination over a period of seven years from 1994 to 2000.
If the number of candidates qualified in 1998 was 21200, what was the number of candidates appeared in 1998?
View solution
Q. The following line graph gives the percentage of the number of candidates who qualified an examination out of the total number of candidates who appeared for the examination over a period of seven years from 1994 to 2000.
If the total number of candidates appeared in 1996 and 1997 together was 47400, then the total number of candidates qualified in these two years together was?
View solution
Q. The following line graph gives the percentage of the number of candidates who qualified an examination out of the total number of candidates who appeared for the examination over a period of seven years from 1994 to 2000.
The total number of candidates qualified in 1999 and 2000 together was 33500 and the number of candidates appeared in 1999 was 26500. What was the number of candidates in 2000?
View solution
Q. The following line graph gives the annual percent profit earned by a Company during the period 1995 - 2000.
If the expenditures in 1996 and 1999 are equal, then the approximate ratio of the income in 1996 and 1999 respectively is?
View solution
Q. The following line graph gives the annual percent profit earned by a Company during the period 1995 - 2000.
If the income in 1998 was Rs. 264 crores, what was the expenditure in 1998?
View solution
Q. The following line graph gives the annual percent profit earned by a Company during the period 1995 - 2000.
In which year is the expenditure minimum?
View solution
Q. The following line graph gives the annual percent profit earned by a Company during the period 1995 - 2000.
If the profit in 1999 was Rs. 4 crores, what was the profit in 2000?
View solution
Q. The following line graph gives the annual percent profit earned by a Company during the period 1995 - 2000.
What is the average profit earned for the given years?
View solution
Q. The following line graph gives the annual percent profit earned by a Company during the period 1995 - 2000.
During which of the following year was the ratio of income to the expenditure the minimum?
View solution
Q. The following line graph gives the annual percent profit earned by a Company during the period 1995 - 2000.
During which year the ratio of percentage profit earned to that in the previous year is the minimum?
View solution
Q. The following line graph gives the annual percent profit earned by a Company during the period 1995 - 2000.
If the expenditure in 2000 is 25% more than expenditure in 1997, then the income in 1997 is what percent less than the income in 2000?
View solution
Q. Answer the question based on the given line graph.
In how many of the given years were the exports more than the imports for Company A?
View solution
Q. Answer the question based on the given line graph.
If the imports of Company A in 1997 were increased by 40 percent, what would be the ratio of exports to the increased imports?
View solution
Q. Answer the question based on the given line graph.
If the exports of Company A in 1998 were Rs. 237 crores, what was the amount of imports in that year?
View solution
Q. Answer the question based on the given line graph.
In 1995, the export of Company A was double that of Company B. If the imports of Company A during the year was Rs. 180 crores, what was the approximate amount of imports pf Company B during that year?
View solution
Q. Answer the question based on the given line graph.
In which year(s) was the difference between imports and exports of Company B the maximum?
View solution
Q. Two different finance companies declare fixed annual rate of interest on the amounts invested with them by investors. The rate of interest offered by these companies may differ from year to year depending on the variation in the economy of the country and the banks rate of interest. The annual rate of interest offered by the two Companies P and Q over the years are shown by the line graph provided below.
A sum of Rs. 4.75 lakhs was invested in Company Q in 1999 for one year. How much more interest would have been earned if the sum was invested in Company P?
View solution
Q. Two different finance companies declare fixed annual rate of interest on the amounts invested with them by investors. The rate of interest offered by these companies may differ from year to year depending on the variation in the economy of the country and the banks rate of interest. The annual rate of interest offered by the two Companies P and Q over the years are shown by the line graph provided below.
If two different amounts in the ratio 8:9 are invested in Companies P and Q respectively in 2002, then the amounts received after one year as interests from Companies P and Q are respectively in the ratio?
View solution
Q. Two different finance companies declare fixed annual rate of interest on the amounts invested with them by investors. The rate of interest offered by these companies may differ from year to year depending on the variation in the economy of the country and the banks rate of interest. The annual rate of interest offered by the two Companies P and Q over the years are shown by the line graph provided below.
In 2000, a part of Rs. 30 lakhs was invested in Company P and the rest was invested in Company Q for one year. The total interest received was Rs. 2.43 lakhs. What was the amount invested in Company P?
View solution
Recommended Subjects
Are you eager to expand your knowledge beyond Data Interpretation? We've handpicked a range of related categories that you might find intriguing.
Click on the categories below to discover a wealth of MCQs and enrich your understanding of various subjects. Happy exploring!