Question
a.
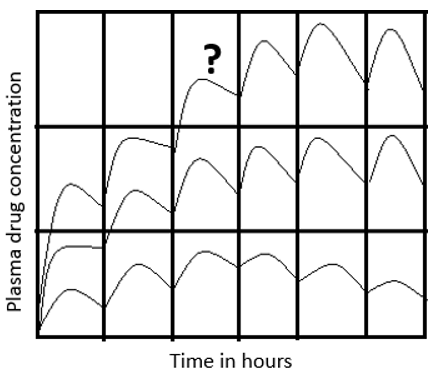
Larger dose
b.
Optimum dose
c.
Smaller dose
d.
Lethal dose
Posted under Drug and Pharmaceutical Biotechnology
Interact with the Community - Share Your Thoughts
Uncertain About the Answer? Seek Clarification Here.
Understand the Explanation? Include it Here.
Q. In the given picture of a graph plotted between the plasma concentration versus time, the marked curve is for which kind of dosage?
Similar Questions
Explore Relevant Multiple Choice Questions (MCQs)
Q. In the given picture of a graph plotted between the plasma concentrations versus time, the marked curve is for which kind of dosage?
View solution
Q. In the given picture of a graph plotted between the plasma concentration versus time, the marked curve is for which kind of dosage?
View solution
Q. Which class of drugs has these common structural features?
View solution
Q. Choose the correct option for the marked place.
View solution
Q. Choose the correct option for the marked place.
View solution
Q. Which enzyme should be present for the conversion of angiotensinogen to angiotensin I?
View solution
Q. Which of the flowing enzyme should be present in the marked place?
View solution
Q. Which will be the correct option for the marked place?
View solution
Q. Which will be the correct option for the marked place?
View solution
Q. Which will be the correct option for the marked place?
View solution
Q. Which will be the correct option for the marked place?
View solution
Q. Which will be the correct option for the marked place?
View solution
Q. Which will be the correct option for the marked place?
View solution
Q. Which will be the correct option for the marked place?
View solution
Recommended Subjects
Are you eager to expand your knowledge beyond Drug and Pharmaceutical Biotechnology? We've handpicked a range of related categories that you might find intriguing.
Click on the categories below to discover a wealth of MCQs and enrich your understanding of various subjects. Happy exploring!