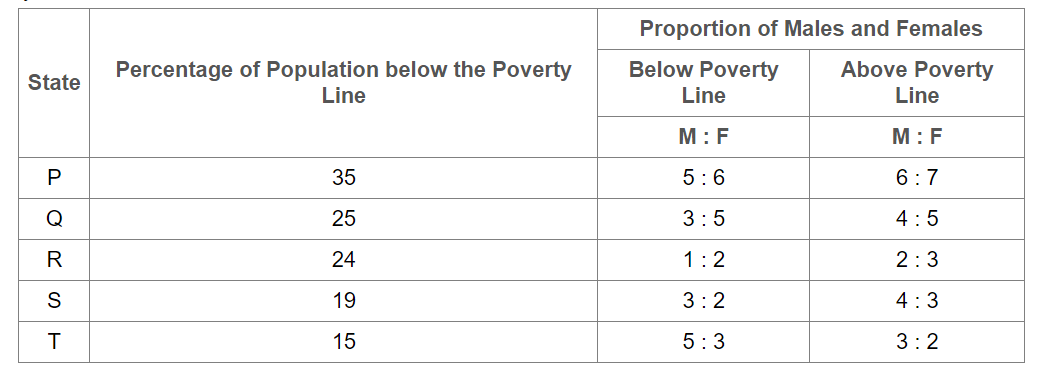
Question
If the male population above poverty line for State R is 1.9 million, then the total population of State R is?

a.
4.5 million
b.
4.85 million
c.
5.35 million
d.
6.25 million
Posted under Data Interpretation
Interact with the Community - Share Your Thoughts
Uncertain About the Answer? Seek Clarification Here.
Understand the Explanation? Include it Here.
Q. The following table gives the percentage distribution of population of five states, P, Q, R, S and T on the basis of poverty line and also on the basis of sex. If the male...
Similar Questions
Explore Relevant Multiple Choice Questions (MCQs)
Q. The following table shows the number of new employees added to different categories of employees in a company and also the number of employees from these categories who left the company every year since the foundation of the Company in 1995.
During the period between 1995 and 2000, the total number of Operators who left the Company is what percent of total number of Operators who joined the Company?
View solution
Q. The following table shows the number of new employees added to different categories of employees in a company and also the number of employees from these categories who left the company every year since the foundation of the Company in 1995.
What is the pooled average of the total number of employees of all categories in the year 1997?
View solution
Q. The following table shows the number of new employees added to different categories of employees in a company and also the number of employees from these categories who left the company every year since the foundation of the Company in 1995.
For which of the following categories the percentage increase in the number of employees working in the Company from 1995 to 2000 was the maximum?
View solution
Q. The following table shows the number of new employees added to different categories of employees in a company and also the number of employees from these categories who left the company every year since the foundation of the Company in 1995.
What was the total number of Peons working in the Company in the year 1999?
View solution
Q. The following table shows the number of new employees added to different categories of employees in a company and also the number of employees from these categories who left the company every year since the foundation of the Company in 1995.
What is the difference between the total number of Technicians added to the Company and the total number of Accountants added to the Company during the years 1996 to 2000?
View solution
Q. A school has four sections A, B, C, D of Class IX students.
Which section has the minimum failure rate in half yearly examination?
View solution
Q. A school has four sections A, B, C, D of Class IX students.
Which section has the maximum success rate in annual examination?
View solution
Q. A school has four sections A, B, C, D of Class IX students.
Which section has the maximum pass percentage in at least one of the two examinations?
View solution
Q. A school has four sections A, B, C, D of Class IX students.
How many students are there in Class IX in the school?
View solution
Q. A school has four sections A, B, C, D of Class IX students.
If the number of students passing an examination be considered a criteria for comparision of difficulty level of two examinations, which of the following statements is true in this context?
View solution
Q. The following table gives the sales of batteries manufactured by a company over the years.
In case of which battery there was a continuous decrease in sales from 1992 to 1997?
View solution
Q. The following table gives the sales of batteries manufactured by a company over the years.
The percentage of 4AH batteries sold to the total number of batteries sold was maximum in the year?
View solution
Q. The following table gives the sales of batteries manufactured by a company over the years.
What is the difference in the number of 35AH batteries sold in 1993 and 1997?
View solution
Q. The following table gives the sales of batteries manufactured by a company over the years.
The total sales of all the seven years is the maximum for which battery?
View solution
Q. The following table gives the sales of batteries manufactured by a company over the years.
What was the approximate percentage increase in the sales of 55AH batteries in 1998 compared to that in 1992?
View solution
Q. Study the following table and answer the question based on it.
What is the approximate percentage of total number of candidates selected to the total number of candidates qualified for all five states together during the year 1999?
View solution
Q. Study the following table and answer the question based on it.
The percentage of candidates selected from U.P over those qualified from U.P is highest in the year?
View solution
Q. Study the following table and answer the question based on it.
The number of candidates selected from Haryana during the period under review is approximately what percent of the number selected from Delhi during this period?
View solution
Q. Study the following table and answer the question based on it.
In the year 1997, which state had the lowest percentage of candidates selected over the candidates appeared?
View solution
Q. Study the following table and answer the question based on it.
The percentage of candidates qualified from Punjab over those appeared from Punjab is highest in the year?
View solution
Recommended Subjects
Are you eager to expand your knowledge beyond Data Interpretation? We've handpicked a range of related categories that you might find intriguing.
Click on the categories below to discover a wealth of MCQs and enrich your understanding of various subjects. Happy exploring!


