Question
The average production of 1996 and 1997 was exactly equal to the average production of which of the following pairs of years?
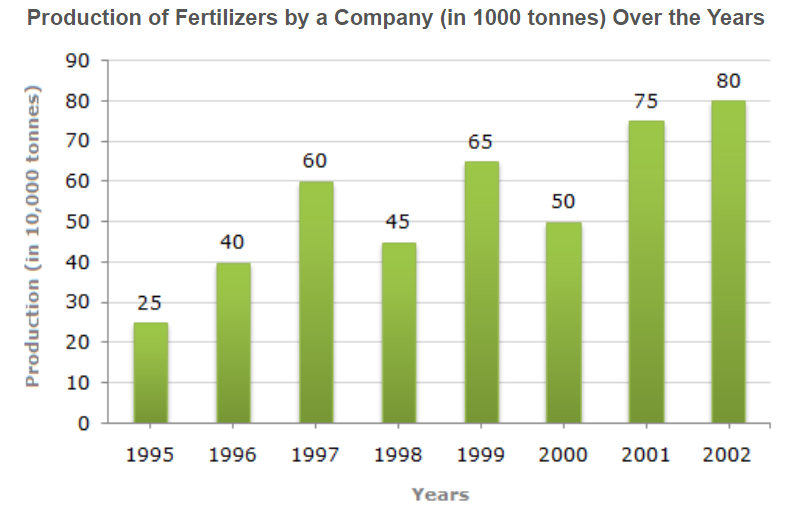
a.
2000 and 2001
b.
1999 and 2000
c.
1998 and 2000
d.
1995 and 2001
Posted under Data Interpretation
Interact with the Community - Share Your Thoughts
Uncertain About the Answer? Seek Clarification Here.
Understand the Explanation? Include it Here.
Q. Study the bar chart and answer the question based on it. The average production of 1996 and 1997 was exactly equal to the average production of which of the following pairs of...
Similar Questions
Explore Relevant Multiple Choice Questions (MCQs)
Q. Study the bar chart and answer the question based on it.
What was the percentage increase in production of fertilizers in 2002 compared to that in 1995?
View solution
Q. Study the bar chart and answer the question based on it.
In which year was the percentage increase in production as compared to the previous year the maximum?
View solution
Q. Study the bar chart and answer the question based on it.
In how many of the given years was the production of fertilizers more than the average production of the given years?
View solution
Q. The bar graph given below shows the percentage distribution of the total expenditures of a company under various expense heads during 2003.
The total amount of expenditures of the company is how many times of expenditure on research and development?
View solution
Q. The bar graph given below shows the percentage distribution of the total expenditures of a company under various expense heads during 2003.
If the expenditure on advertisement is 2.10 crores then the difference between the expenditure on transport and taxes is?
View solution
Q. The bar graph given below shows the percentage distribution of the total expenditures of a company under various expense heads during 2003.
What is the ratio of the total expenditure on infrastructure and transport to the total expenditure on taxes and interest on loans?
View solution
Q. The bar graph given below shows the percentage distribution of the total expenditures of a company under various expense heads during 2003.
If the interest on loans amounted to Rs. 2.45 crores then the total amount of expenditure on advertisement, taxes and research and development is?
View solution
Q. The bar graph given below shows the percentage distribution of the total expenditures of a company under various expense heads during 2003.
The expenditure on the interest on loans is by what percent more than the expenditure on transport?
View solution
Q. A cosmetic company provides five different products. The sales of these five products (in lakh number of packs) during 1995 and 2000 are shown in the following bar graph.
The sales of lipsticks in 2000 was by what percent more than the sales of nail enamels in 2000? (rounded off to nearest integer)
View solution
Q. A cosmetic company provides five different products. The sales of these five products (in lakh number of packs) during 1995 and 2000 are shown in the following bar graph.
During the period 1995-2000, the minimum rate of increase in sales is in the case of?
View solution
Q. A cosmetic company provides five different products. The sales of these five products (in lakh number of packs) during 1995 and 2000 are shown in the following bar graph.
What is the approximate ratio of the sales of nail enamels in 2000 to the sales of Talcum powders in 1995?
View solution
Q. A cosmetic company provides five different products. The sales of these five products (in lakh number of packs) during 1995 and 2000 are shown in the following bar graph.
The sales have increase by nearly 55% from 1995 to 2000 in the case of?
View solution
Q. A cosmetic company provides five different products. The sales of these five products (in lakh number of packs) during 1995 and 2000 are shown in the following bar graph.
The sales of conditioners in 1995 was by what percent less than the sales of shampoos in 1995? (rounded off to nearest integer)
View solution
Q. A soft drink company prepares drinks of three different flavours - X, Y and Z. The production of three flavours over a period of six years has been expressed in the bar graph provided below.
The total production of flovour Z in 1997 and 1998 is what percentage of the total production of flavour X in 1995 and 1996?
View solution
Q. A soft drink company prepares drinks of three different flavours - X, Y and Z. The production of three flavours over a period of six years has been expressed in the bar graph provided below.
For which flavour was the average annual production maximum in the given period?
View solution
Q. A soft drink company prepares drinks of three different flavours - X, Y and Z. The production of three flavours over a period of six years has been expressed in the bar graph provided below.
What is the difference between the average production of flavour X in 1995, 1996 and 1997 and the average production of flavour Y in 1998, 1999 and 2000?
View solution
Q. A soft drink company prepares drinks of three different flavours - X, Y and Z. The production of three flavours over a period of six years has been expressed in the bar graph provided below.
What was the approximate decline in the production of flavour Z in 2000 as compared to the production in 1998?
View solution
Q. A soft drink company prepares drinks of three different flavours - X, Y and Z. The production of three flavours over a period of six years has been expressed in the bar graph provided below.
For which of the following years the percentage of rise/fall in production from the previous year is the maximum for the flavour Y?
View solution
Q. The bar graph given below shows the percentage distribution of the total production of a car manufacturing company into various models over two years.
What was the difference in the number of Q type cars produced in 2000 and that produced in 2001?
View solution
Q. The bar graph given below shows the percentage distribution of the total production of a car manufacturing company into various models over two years.
Total number of cars of models P, Q and T manufactured in 2000 is?
View solution
Recommended Subjects
Are you eager to expand your knowledge beyond Data Interpretation? We've handpicked a range of related categories that you might find intriguing.
Click on the categories below to discover a wealth of MCQs and enrich your understanding of various subjects. Happy exploring!