Question
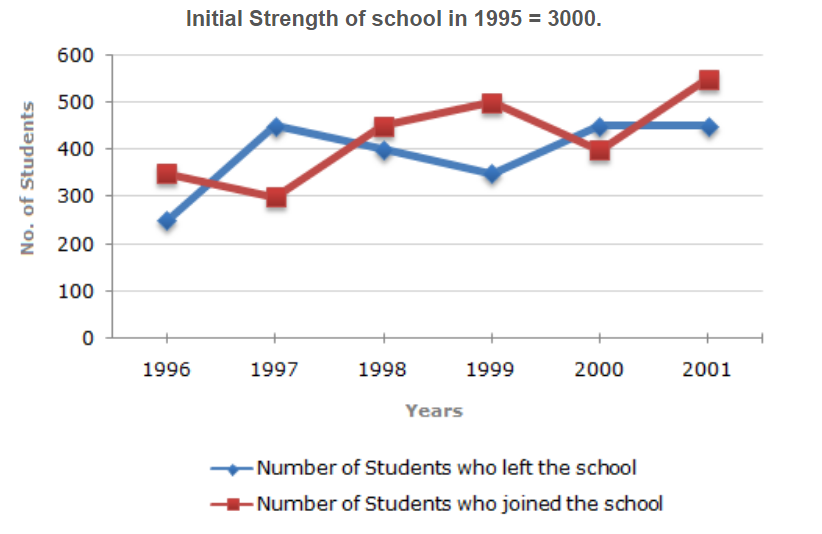
For which year, the percentage rise/fall in the number of students who left the school compared to the previous year is maximum?

a.
1997
b.
1998
c.
1999
d.
2000
Posted under Data Interpretation
Interact with the Community - Share Your Thoughts
Uncertain About the Answer? Seek Clarification Here.
Understand the Explanation? Include it Here.
Q. Study the following line graph which gives the number of students who joined and left the school in the beginning of year for six years, from 1996 to 2001. For which year, the...
Similar Questions
Explore Relevant Multiple Choice Questions (MCQs)
Q. Study the following line graph which gives the number of students who joined and left the school in the beginning of year for six years, from 1996 to 2001.
The strength of school increased/decreased from 1997 to 1998 by approximately what percent?
View solution
Q. Study the following line graph which gives the number of students who joined and left the school in the beginning of year for six years, from 1996 to 2001.
The number of students studying in the school in 1998 was what percent of the number of students studying in the school in 2001?
View solution
Q. Study the following line graph which gives the number of students who joined and left the school in the beginning of year for six years, from 1996 to 2001.
The ratio of the least number of students who joined the school to the maximum number of students who left the school in any of the years during the given period is?
View solution
Q. Study the following line graph which gives the number of students who joined and left the school in the beginning of year for six years, from 1996 to 2001.
During which of the following pairs of years, the strength of the school was same?
View solution
Q. Study the following line graph which gives the number of students who joined and left the school in the beginning of year for six years, from 1996 to 2001.
Among the given years, the largest number of students joined the school in the year?
View solution
Q. In a school the periodical examination are held every second month. In a session during April 2001 - March 2002, a student of Class IX appeared for each of the periodical exams. The aggregate marks obtained by him in each periodical exam are represented in the line-graph given below.
In which periodical exams did the student obtain the highest percentage increase in marks over the previous periodical exams ?
View solution
Q. In a school the periodical examination are held every second month. In a session during April 2001 - March 2002, a student of Class IX appeared for each of the periodical exams. The aggregate marks obtained by him in each periodical exam are represented in the line-graph given below.
The total number of marks obtained in Feb. 02 is what percent of the total marks obtained in April 01 ?
View solution
Q. In a school the periodical examination are held every second month. In a session during April 2001 - March 2002, a student of Class IX appeared for each of the periodical exams. The aggregate marks obtained by him in each periodical exam are represented in the line-graph given below.
What is the percentage of marks obtained by the student in the periodical exams of August, 01 and Oct, 01 taken together ?
View solution
Q. In a school the periodical examination are held every second month. In a session during April 2001 - March 2002, a student of Class IX appeared for each of the periodical exams. The aggregate marks obtained by him in each periodical exam are represented in the line-graph given below.
What are the average marks obtained by the student in all the periodical exams during the last session ?
View solution
Q. In a school the periodical examination are held every second month. In a session during April 2001 - March 2002, a student of Class IX appeared for each of the periodical exams. The aggregate marks obtained by him in each periodical exam are represented in the line-graph given below.
In which periodical exams there is a fall in percentage of marks as compared to the previous periodical exams ?
View solution
Recommended Subjects
Are you eager to expand your knowledge beyond Data Interpretation? We've handpicked a range of related categories that you might find intriguing.
Click on the categories below to discover a wealth of MCQs and enrich your understanding of various subjects. Happy exploring!


