Question

a.
A
b.
B
c.
C
d.
D
Posted under Electronics and Communication Engineering
Interact with the Community - Share Your Thoughts
Uncertain About the Answer? Seek Clarification Here.
Understand the Explanation? Include it Here.
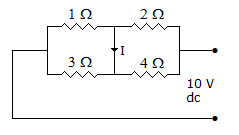
Q. In figure, I =
Similar Questions
Explore Relevant Multiple Choice Questions (MCQs)
Q. If Ia, Ib, Ic are line currents and Ia1 is the positive sequences component of Ia then
View solution
Q. In the two ports network shown in the figure, Z12 and Z21 are, respectively
View solution
Q. In figure, I = 2A, then V =
View solution
Q. In the circuit shown in the given figure, V0 is given by
View solution
Q. The value of current read by ideal ammeter A in figure is __________ ampere.
View solution
Q. The relation between the apparent power, actual power and reactive power is given by
View solution
Q. Quality factor will be
View solution
Q. In the circuit shown in the given figure, switch k is closed at t = 0. The circuit was initially relaxed then which one of the following sources of v(t) will produce maximum current at t = 0+?
View solution
Q. The inverse Fourier transform of following is
View solution
Q. Which one of the following is a cut set of the graph in the given figure?
View solution
Q. At t = 0+, the current i1 is
View solution
Q. Which one of the following theorem can be conveniently used to calculate the power consumed by the 10 Ω resistor in the network shown in the above figure?
View solution
Q. Figure shows a parallel resonant circuit having resonance frequency of 15 MHZ. At this frequency
View solution
Q. A series RL circuit is excited by a voltage v(t) = Ve^(-at) such that a = R/L. Then the circuit current is
View solution
Q. In the transformer shown in the figure, the inductance measured across the terminal 1 and 2 was 4 H with open terminals 3 and 4. It was 3H when the terminals 3 and 4 were short circuited. The coefficient of coupling would be
View solution
Q. The condition on R, L and C such that the step response y(t) in the figure has no oscillation, is
View solution
Q. In the transformer shown in figure, the inductance measured across terminal 1 and 2 was 4 H with terminals 3 and 4 open. It was 3H when terminals 3 and 4 are short circuited. The coefficient of coupling is
View solution
Q. The time constant of the network shown in figure is, when switch is closed.
View solution
Q. In figure the phase plot
View solution
Q. The graph of a network is shown in the figure. Which one of the figure shown is not a tree of the graph?
View solution
Recommended Subjects
Are you eager to expand your knowledge beyond Electronics and Communication Engineering? We've handpicked a range of related categories that you might find intriguing.
Click on the categories below to discover a wealth of MCQs and enrich your understanding of various subjects. Happy exploring!