Question
a.
Effect of the polarity of A and B
b.
Variation in the apparent equilibrium constants
c.
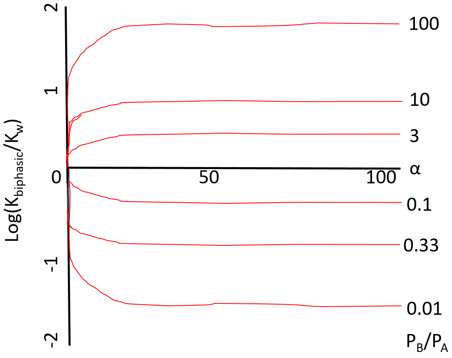
Effect of the ratio of the partition coefficients
d.
Variation in the apparent equilibrium constant and percentage yield
Posted under Enzyme Technology
Interact with the Community - Share Your Thoughts
Uncertain About the Answer? Seek Clarification Here.
Understand the Explanation? Include it Here.
Q. What does the following graph represents?
Similar Questions
Explore Relevant Multiple Choice Questions (MCQs)
Q. What is represented in the following plot?
View solution
Q. What does the diagram depict?
View solution
Q. What is represented in the plot?
View solution
Q. What does the plot in the diagram depict?
View solution
Q. Which of these is a cleavage site for chymotrypsin?
View solution
Q. Which of these is a cleavage site for trypsin?
View solution
Q. Cleavage site for pepsin is _______________
View solution
Q. What kind of process is represented in the following equation?
View solution
Q. What does the following reaction represent?
View solution
Q. What is represented in the following diagram?
View solution
Recommended Subjects
Are you eager to expand your knowledge beyond Enzyme Technology? We've handpicked a range of related categories that you might find intriguing.
Click on the categories below to discover a wealth of MCQs and enrich your understanding of various subjects. Happy exploring!