Question
a.
Production of aspartame
b.
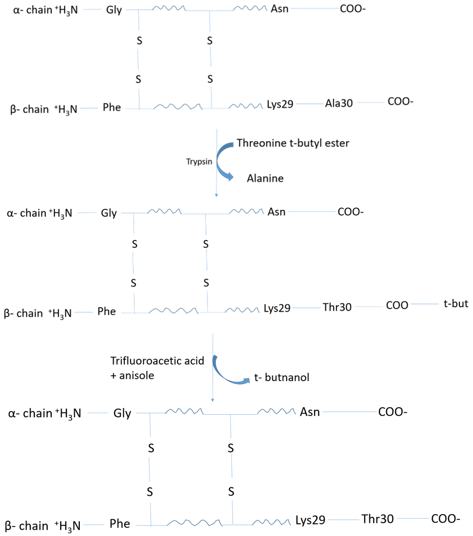
Production of insulin
c.
Production of penicillin
d.
Production of glucose syrups
Posted under Enzyme Technology
Interact with the Community - Share Your Thoughts
Uncertain About the Answer? Seek Clarification Here.
Understand the Explanation? Include it Here.
Q. What is represented in the following diagram?
Similar Questions
Explore Relevant Multiple Choice Questions (MCQs)
Q. What does the following reaction represent?
View solution
Q. What kind of process is represented in the following equation?
View solution
Q. Cleavage site for pepsin is _______________
View solution
Q. Which of these is a cleavage site for trypsin?
View solution
Q. Which of these is a cleavage site for chymotrypsin?
View solution
Q. What does the plot in the diagram depict?
View solution
Q. What is represented in the plot?
View solution
Q. What does the diagram depict?
View solution
Q. What is represented in the following plot?
View solution
Q. What does the following graph represents?
View solution
Q. What does Pᴀ represent in the following reaction?
View solution
Q. In the below reaction, Kw is represented by ___________
View solution
Q. What is represented in the following diagram?
View solution
Q. What is represented in the following diagram?
View solution
Q. What does the following diagram represent?
View solution
Q. What does ‘X’ represent in the following reaction?
Ethyl acetate + isoamylalchohol \(\underset{Lipase}{\rightleftharpoons}\) X + ethanol
View solution
Q. Cocoa butter is a fat which is not used in confectionery.
View solution
Q. For which of the following, acidolysis reaction is not required?
View solution
Q. Cocoa butter may be produced by using ________ acting as transacylases.
View solution
Q. Alcoholyses allows the exchange of alcohol between esters and alcohols by use of _________ enzyme.
View solution
Recommended Subjects
Are you eager to expand your knowledge beyond Enzyme Technology? We've handpicked a range of related categories that you might find intriguing.
Click on the categories below to discover a wealth of MCQs and enrich your understanding of various subjects. Happy exploring!