Question
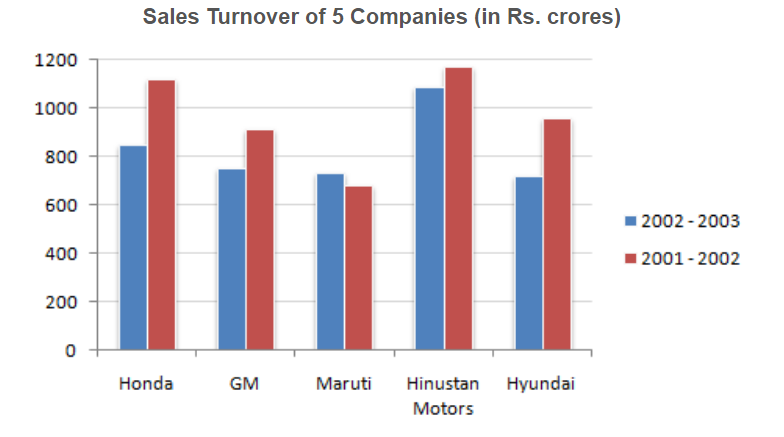
What is the approximate difference between the average sales turnover of all the companies put together between the years 2001 - 2002 and 2002 - 2003 ?
a.
133.45
b.
142.48
c.
117.6
d.
None of these
Posted under Data Interpretation
Interact with the Community - Share Your Thoughts
Uncertain About the Answer? Seek Clarification Here.
Understand the Explanation? Include it Here.
Q. Study the following bar chart and answer the questions carefully. What is the approximate difference between the average sales turnover of all the companies put together between...
Similar Questions
Explore Relevant Multiple Choice Questions (MCQs)
Q. The following chart shows the production of cars in thousands.
How many companies have shown production below their average production in 2002 - 2003, but have showed above the average production in 2003 - 2004 ?
View solution
Q. The following chart shows the production of cars in thousands.
The ratio of Hindustan Motors production in 2003 - 2004 to Honda's production in 2002 - 2003 is ?
View solution
Q. The following chart shows the production of cars in thousands.
For how many companies has there been no decrease in production in any year from the previous year ?
View solution
Q. The total of the first three deficit countries (in Rs. crores) = 3594.3. The total of next five deficit countries (in Rs. crores) = 2588.5. The total of the last five deficit countries (in Rs. crores) = 334.2.
The ratio between the difference between the highest and the lowest of the surplus countries to the difference between Bangladesh and Oman is ?
View solution
Q. The total of the first three deficit countries (in Rs. crores) = 3594.3. The total of next five deficit countries (in Rs. crores) = 2588.5. The total of the last five deficit countries (in Rs. crores) = 334.2.
The average of the total deficit of the middle five deficit is closest to the deficit of which country ?
View solution
Q. The total of the first three deficit countries (in Rs. crores) = 3594.3. The total of next five deficit countries (in Rs. crores) = 2588.5. The total of the last five deficit countries (in Rs. crores) = 334.2.
The state whose surplus is nearly equal to the average of the four surplus countries is
View solution
Q. The total of the first three deficit countries (in Rs. crores) = 3594.3. The total of next five deficit countries (in Rs. crores) = 2588.5. The total of the last five deficit countries (in Rs. crores) = 334.2.
The ratio of the deficit of the first five deficit countries to the overall deficit of all the deficit countries is nearly equal to ?
View solution
Q. The total of the first three deficit countries (in Rs. crores) = 3594.3. The total of next five deficit countries (in Rs. crores) = 2588.5. The total of the last five deficit countries (in Rs. crores) = 334.2.
The net total deficit/surplus is equal to ?
View solution
Q. Study the following bar charts and answer the question.
The ratio of the maximum exports to the minimum imports was closest to ?
View solution
Q. Study the following bar charts and answer the question.
How many countries exhibited a trade surplus ?
View solution
Q. Study the following bar charts and answer the question.
The total trade deficit/surplus for all the countries put together was ?
View solution
Q. Study the following bar charts and answer the question.
The highest trade deficit was shown by which country ?
View solution
Q. Study the following bar charts and answer the question.
The ratio of Exports to Imports was highest for which country ?
View solution
Q. The following bar chart shows the composition of the GDP two countries (India and Pakistan).
If the total GDP of Pakistan is Rs. 10,000 crore, then a GDP accounted for by Manufacturing is ?
View solution
Q. The following bar chart shows the composition of the GDP two countries (India and Pakistan).
What fraction of India's GDP is accounted for by Services ?
View solution
Q. The following bar chart shows the composition of the GDP two countries (India and Pakistan).
If the total GDP of India is Rs.30,000 crores, then the GDP accounted for by Agriculture, Services and Miscellaneous is ?
View solution
Q. The following bar chart shows the composition of the GDP two countries (India and Pakistan).
Which country accounts for higher earning out of Services and Miscellaneous together ?
View solution
Q. The following bar chart shows the composition of the GDP two countries (India and Pakistan).
If the total GDP is the same for both the countries, then what percentage is Pakistan's income through agriculture over India's income through Services ?
View solution
Recommended Subjects
Are you eager to expand your knowledge beyond Data Interpretation? We've handpicked a range of related categories that you might find intriguing.
Click on the categories below to discover a wealth of MCQs and enrich your understanding of various subjects. Happy exploring!