Question
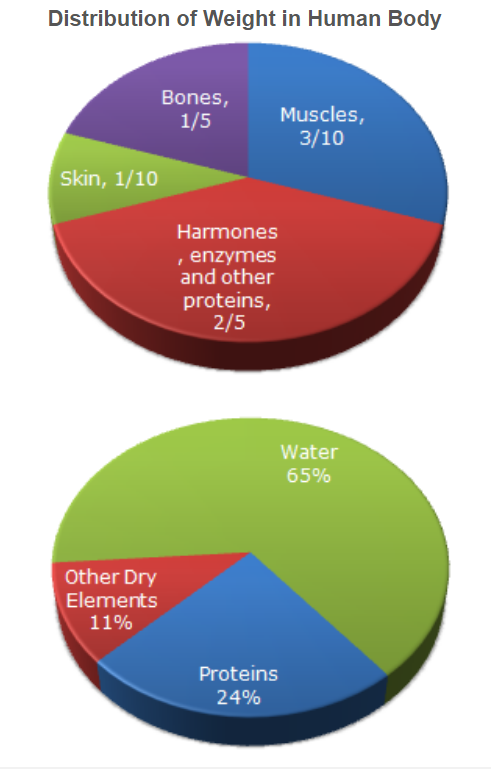
What percentage of proteins of the human body is equivalent to the weight of its skin ?
a.
41.66 %
b.
43.33 %
c.
44.44 %
d.
Cannot be determined
Posted under Data Interpretation
Interact with the Community - Share Your Thoughts
Uncertain About the Answer? Seek Clarification Here.
Understand the Explanation? Include it Here.
Q. The following pie chart give the information about the distribution of weight in the human body according to different kinds of components. Study the pie charts and answer the...
Similar Questions
Explore Relevant Multiple Choice Questions (MCQs)
Q. The following pie chart give the information about the distribution of weight in the human body according to different kinds of components. Study the pie charts and answer the question.
How much of the human body is neither made of bones or skin ?
View solution
Q. The following pie chart give the information about the distribution of weight in the human body according to different kinds of components. Study the pie charts and answer the question.
What is the ratio of the distribution of proteins in the muscles to that of the distribution of proteins in the bones ?
View solution
Q. Analyse the pie charts and answer the following question.
For the year 2005, which company has realised the lowest average unit sales price for a PC ?
View solution
Q. Analyse the pie charts and answer the following question.
Over the period 2005-2006, if sales (value-wise) of IBM PC's increased by 50% and of Apple by 15% assuming that PC sales of all other computer companies remained the same, by what percentage (approximately) would the PC sales in New York (value-wise) increase over the same period ?
View solution
Q. Analyse the pie charts and answer the following question.
In 2005, the average unit sale price of an IBM PC was approximately (in US$)
View solution
Q. The following pie-chart shows the sources of funds to be collected by the National Highways Authority of India (NHAI) for its Phase II projects. Study the pie-chart and answers the following question.
Near about 20% of the funds are to be arranged through:
View solution
Q. The following pie-chart shows the sources of funds to be collected by the National Highways Authority of India (NHAI) for its Phase II projects. Study the pie-chart and answers the following question.
If NHAI could receive a total of Rs. 9695 crores as External Assistance, by what percent (approximately) should it increase the Market Borrowing to arrange for the shortage of funds?
View solution
Q. The following pie-chart shows the sources of funds to be collected by the National Highways Authority of India (NHAI) for its Phase II projects. Study the pie-chart and answers the following question.
If the toll is to be collected through an outsourced agency by allowing a maximum 10% commission, how much amount should be permitted to be collected by the outsourced agency, so that the project is supported with Rs. 4910 crores?
View solution
Q. The following pie-chart shows the sources of funds to be collected by the National Highways Authority of India (NHAI) for its Phase II projects. Study the pie-chart and answers the following question.
The central angle corresponding to Market Borrowing is
View solution
Q. The following pie-chart shows the sources of funds to be collected by the National Highways Authority of India (NHAI) for its Phase II projects. Study the pie-chart and answers the following question.
The approximate ratio of the funds to be arranged through Toll and that through Market Borrowing is
View solution
Q. The following pie-charts show the distribution of students of graduate and post-graduate levels in seven different institutes in a town.
What is the total number of graduate and post-graduate level students is institute R?
View solution
Q. The following pie-charts show the distribution of students of graduate and post-graduate levels in seven different institutes in a town.
What is the ratio between the number of students studying at post-graduate and graduate levels respectively from institute S?
View solution
Q. The following pie-charts show the distribution of students of graduate and post-graduate levels in seven different institutes in a town.
How many students of institutes of M and S are studying at graduate level?
View solution
Q. The following pie-charts show the distribution of students of graduate and post-graduate levels in seven different institutes in a town.
What is the ratio between the number of students studying at post-graduate level from institutes S and the number of students studying at graduate level from institute Q?
View solution
Q. The following pie-charts show the distribution of students of graduate and post-graduate levels in seven different institutes in a town.
Total number of students studying at post-graduate level from institutes N and P is
View solution
Q. Study the following pie-chart and the table and answer the following question based on them.
If the population of village R in 1997 is 32000, then what will be the population of village Y below poverty line in that year?
View solution
Q. Study the following pie-chart and the table and answer the following question based on them.
The ratio of population of village T below poverty line to that of village Z below poverty line in 1997 is:
View solution
Q. Study the following pie-chart and the table and answer the following question based on them.
Find the population of village S if the population of village X below poverty line in 1997 is 12160.
View solution
Q. Study the following pie-chart and the table and answer the following question based on them.
If in 1998, the population of villages Y and V increase by 10% each and the percentage of population below poverty line remains unchanged for all the villages, then find the population of village V below poverty line in 1998, given that the population of village Y in 1997 was 30000.
View solution
Q. The following pie chart shows the amount of subscriptions generated for India Bonds from different categories of investors.
In the corporate sector, approximately how many degrees should be there in the central angle ?
View solution
Recommended Subjects
Are you eager to expand your knowledge beyond Data Interpretation? We've handpicked a range of related categories that you might find intriguing.
Click on the categories below to discover a wealth of MCQs and enrich your understanding of various subjects. Happy exploring!