Question
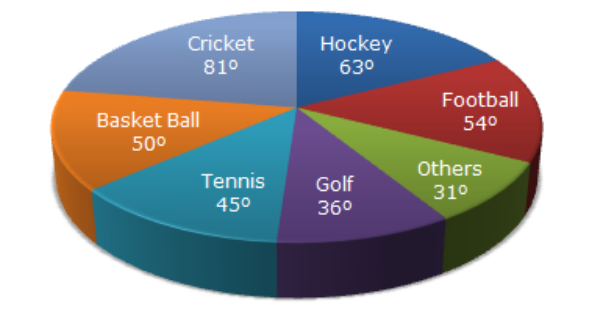
If the total amount spent on sports during the year be Rs. 1,80,00,000 , the amount spent on Basketball exceeds on Tennis by:
a.
Rs. 2,50,000
b.
Rs. 3,60,000
c.
Rs. 3,75,000
d.
Rs. 4,10,000
Posted under Data Interpretation
Interact with the Community - Share Your Thoughts
Uncertain About the Answer? Seek Clarification Here.
Understand the Explanation? Include it Here.
Q. The circle-graph given here shows the spending of a country on various sports during a particular year. Study the graph carefully and answer the following question. If the total...
Similar Questions
Explore Relevant Multiple Choice Questions (MCQs)
Q. The circle-graph given here shows the spending of a country on various sports during a particular year. Study the graph carefully and answer the following question.
How much percent less is spent on Football than that on Cricket?
View solution
Q. The circle-graph given here shows the spending of a country on various sports during a particular year. Study the graph carefully and answer the following question.
If the total amount spent on sports during the year was Rs. 2 crores, the amount spent on Cricket and Hockey together was:
View solution
Q. Study the following graph carefully and answer the questions given below:
What percentage of candidates passed the Exam from institute T out of the total number of candidates enrolled from the same institute?
View solution
Q. Study the following graph carefully and answer the questions given below:
Which institute has the highest percentage of candidates passed to the candidates enrolled?
View solution
Q. Study the following graph carefully and answer the questions given below:
The number of candidates passed from institutes S and P together exceeds the number of candidates enrolled from institutes T and R together by:
View solution
Q. Study the following graph carefully and answer the questions given below:
What is the percentage of candidates passed to the candidates enrolled for institutes Q and R together?
View solution
Q. Study the following graph carefully and answer the questions given below:
What is the ratio of candidates passed to the candidates enrolled from institute P?
View solution
Q. Study the pie-diagrams carefully and answer the following question.
What percent of the total weight of human body is equivalent to the weight of the proteins in skin in human body?
View solution
Q. Study the pie-diagrams carefully and answer the following question.
What will be the quantity of water in the body of a person weighing 50 kg?
View solution
Q. Study the pie-diagrams carefully and answer the following question.
What is the ratio of the distribution of proteins in the muscles to that of the distribution of proteins in the bones?
View solution
Q. Study the pie-diagrams carefully and answer the following question.
To show the distribution of proteins and other dry elements in the human body, the arc of the circle should subtend at the centre an angle of:
View solution
Q. Study the pie-diagrams carefully and answer the following question.
In the human body, what part is made of neither bones nor skin?
View solution
Q. Study the following graph and the table and answer the question given below.
What will be the percentage of total number of males in U.P., M.P. and Goa together to the total population of all the given states?
View solution
Q. Study the following graph and the table and answer the question given below.
What was the total number of illiterate people in A.P. and M.P. in 1998?
View solution
Q. Study the following graph and the table and answer the question given below.
What is the ratio of the number of females in T.N. to the number of females in Delhi?
View solution
Q. Study the following graph and the table and answer the question given below.
What was the number of males in U.P. in the year 1998?
View solution
Q. Study the following graph and the table and answer the question given below.
If in the year 1998, there was an increase of 10% in the population of U.P. and 12% in the population of M.P. compared to the previous year, then what was the ratio of populations of U.P. and M.P. in 1997?
View solution
Recommended Subjects
Are you eager to expand your knowledge beyond Data Interpretation? We've handpicked a range of related categories that you might find intriguing.
Click on the categories below to discover a wealth of MCQs and enrich your understanding of various subjects. Happy exploring!