Question
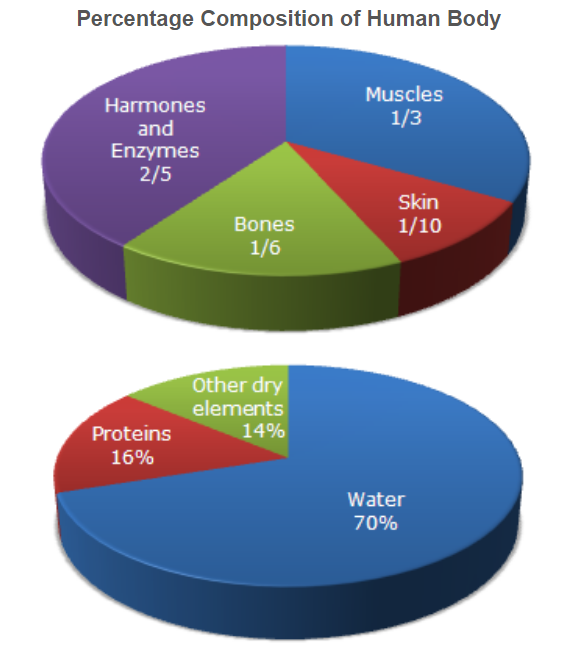
What percent of the total weight of human body is equivalent to the weight of the proteins in skin in human body?
a.
0.016
b.
1.6
c.
0.16
d.
Data inadequate
Posted under Data Interpretation
Interact with the Community - Share Your Thoughts
Uncertain About the Answer? Seek Clarification Here.
Understand the Explanation? Include it Here.
Q. Study the pie-diagrams carefully and answer the following question. What percent of the total weight of human body is equivalent to the weight of the proteins in skin in human...
Similar Questions
Explore Relevant Multiple Choice Questions (MCQs)
Q. Study the following graph carefully and answer the questions given below:
What is the ratio of candidates passed to the candidates enrolled from institute P?
View solution
Q. Study the following graph carefully and answer the questions given below:
What is the percentage of candidates passed to the candidates enrolled for institutes Q and R together?
View solution
Q. Study the following graph carefully and answer the questions given below:
The number of candidates passed from institutes S and P together exceeds the number of candidates enrolled from institutes T and R together by:
View solution
Q. Study the following graph carefully and answer the questions given below:
Which institute has the highest percentage of candidates passed to the candidates enrolled?
View solution
Q. Study the following graph carefully and answer the questions given below:
What percentage of candidates passed the Exam from institute T out of the total number of candidates enrolled from the same institute?
View solution
Q. The circle-graph given here shows the spending of a country on various sports during a particular year. Study the graph carefully and answer the following question.
If the total amount spent on sports during the year was Rs. 2 crores, the amount spent on Cricket and Hockey together was:
View solution
Q. The circle-graph given here shows the spending of a country on various sports during a particular year. Study the graph carefully and answer the following question.
How much percent less is spent on Football than that on Cricket?
View solution
Q. The circle-graph given here shows the spending of a country on various sports during a particular year. Study the graph carefully and answer the following question.
If the total amount spent on sports during the year be Rs. 1,80,00,000 , the amount spent on Basketball exceeds on Tennis by:
View solution
Q. The circle-graph given here shows the spending of a country on various sports during a particular year. Study the graph carefully and answer the following question.
How much percent more is spent on Hockey than that on Golf?
View solution
Q. The circle-graph given here shows the spending of a country on various sports during a particular year. Study the graph carefully and answer the following question.
What percent of total spending is spent on Tennis?
View solution
Q. The following pie chart shows the amount of subscriptions generated for India Bonds from different categories of investors.
What is the approximate ratio of investment flows into India Bonds from NRI's to corporate houses ?
View solution
Q. The following pie chart shows the amount of subscriptions generated for India Bonds from different categories of investors.
If the total investment flows from FII's were to be doubled in the next year and the investment flows from all other sources had remained constant at their existing levels for this year, then what would be the proportion of FII investment in the total investment into India Bonds next year (in US $ millions) ?
View solution
Q. The following pie chart shows the amount of subscriptions generated for India Bonds from different categories of investors.
If the total investment other than by FII and corporate houses is Rs 335,000 crore, then the investment by NRI's and Offshore funds will be (approximately) ?
View solution
Q. The following pie chart shows the amount of subscriptions generated for India Bonds from different categories of investors.
What percentage of the total investment is coming from FII's and NRI's ?
View solution
Q. The following pie chart shows the amount of subscriptions generated for India Bonds from different categories of investors.
If the investment by NRI's are Rs 4,000 crore, then the investments by corporate houses and FII's together is:
View solution
Q. The following pie chart shows the amount of subscriptions generated for India Bonds from different categories of investors.
In the corporate sector, approximately how many degrees should be there in the central angle ?
View solution
Q. Study the following pie-chart and the table and answer the following question based on them.
If in 1998, the population of villages Y and V increase by 10% each and the percentage of population below poverty line remains unchanged for all the villages, then find the population of village V below poverty line in 1998, given that the population of village Y in 1997 was 30000.
View solution
Q. Study the following pie-chart and the table and answer the following question based on them.
Find the population of village S if the population of village X below poverty line in 1997 is 12160.
View solution
Q. Study the following pie-chart and the table and answer the following question based on them.
The ratio of population of village T below poverty line to that of village Z below poverty line in 1997 is:
View solution
Q. Study the following pie-chart and the table and answer the following question based on them.
If the population of village R in 1997 is 32000, then what will be the population of village Y below poverty line in that year?
View solution
Recommended Subjects
Are you eager to expand your knowledge beyond Data Interpretation? We've handpicked a range of related categories that you might find intriguing.
Click on the categories below to discover a wealth of MCQs and enrich your understanding of various subjects. Happy exploring!