Question

a.
A
b.
B
c.
C
d.
D
Posted under Electronics and Communication Engineering
Interact with the Community - Share Your Thoughts
Uncertain About the Answer? Seek Clarification Here.
Understand the Explanation? Include it Here.
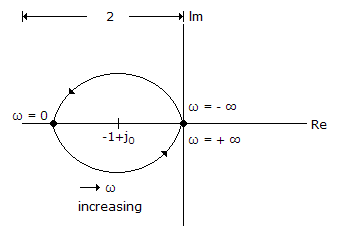
Q. The Nyquist plot in the given figure is for G(s) H(s) =
Similar Questions
Explore Relevant Multiple Choice Questions (MCQs)
Q. For a following factor, the log
View solution
Q. The given figure shows a hybrid servosystem. The components 1, 2, 3, 4 are respectively
View solution
Q. For the signal flow graph of the given figure consider the following statements
1. It has three forward paths
2. It has three individual loops
3. It has two non touching loops
Out of above the correct statements are
View solution
Q. For a second order system, the position of poles is shown in the given figure. This system is
View solution
Q. The pole zero plot of the given figure is for
View solution
Q. Consider the following expressions which indicate the step or impulse response of an initially relaxed system. Those which correspond to the step and impulse response of the same system include
View solution
Q. The given figure shows a control system. The maximum value of gain for which the system is stable is
View solution
Q. The log magnitude for the system in the given figure is (where T = RC)
View solution
Q. In the signal flow graph of the given figure, the number of forward paths is
View solution
Q. If block diagrams of the given figure (a) and (b) are to be equivalent, then
View solution
Q. If block diagrams of the given figure (a) and (b) are to be equivalent, then
View solution
Q. The pole zero plot in the given figure is for
View solution
Q. The phase angle characteristic in the given figure is for
View solution
Q. The polar plot of the given figure can be for G(jω) =
View solution
Q. The system matrix of continuous time system described in state variable form is given below. The systems is stable for all values of x and y satisfying
View solution
Q. For the mechanical system in the given figure the transfer function X(s)/F(s) =
View solution
Q. The given figure shows dB magnitude plots for type 0, type 1 and type 2 systems. Out of these
View solution
Q. For the given figure, the transfer function X(s)/P(s) =
View solution
Q. In the given figure shows a root locus plot. Consider the following statements for this plot
1. The open loop system is a second order system
2. The system is overdamped for K > 1
3. The system is stable for all values of K
Which of the above statements are correct?
View solution
Q. In the given figure the number of combinations of three non touching loops is
View solution
Recommended Subjects
Are you eager to expand your knowledge beyond Electronics and Communication Engineering? We've handpicked a range of related categories that you might find intriguing.
Click on the categories below to discover a wealth of MCQs and enrich your understanding of various subjects. Happy exploring!


