Table Charts MCQs
Welcome to our comprehensive collection of Multiple Choice Questions (MCQs) on Table Charts, a fundamental topic in the field of Data Interpretation. Whether you're preparing for competitive exams, honing your problem-solving skills, or simply looking to enhance your abilities in this field, our Table Charts MCQs are designed to help you grasp the core concepts and excel in solving problems.
In this section, you'll find a wide range of Table Charts mcq questions that explore various aspects of Table Charts problems. Each MCQ is crafted to challenge your understanding of Table Charts principles, enabling you to refine your problem-solving techniques. Whether you're a student aiming to ace Data Interpretation tests, a job seeker preparing for interviews, or someone simply interested in sharpening their skills, our Table Charts MCQs are your pathway to success in mastering this essential Data Interpretation topic.
Note: Each of the following question comes with multiple answer choices. Select the most appropriate option and test your understanding of Table Charts. You can click on an option to test your knowledge before viewing the solution for a MCQ. Happy learning!
So, are you ready to put your Table Charts knowledge to the test? Let's get started with our carefully curated MCQs!
Table Charts MCQs | Page 2 of 5
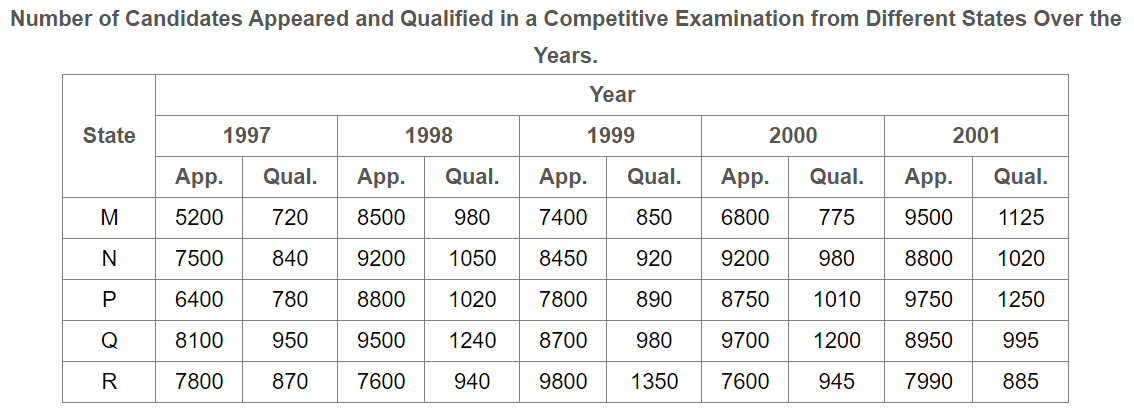
Combining the states P and Q together in 1998, what is the percentage of the candidates qualified to that of the candidate appeared?
What are the average marks obtained by all the seven students in Physics? (rounded off to two digit after decimal)

The number of students who obtained 60% and above marks in all subjects is?

What was the aggregate of marks obtained by Sajal in all the six subjects?

In which subject is the overall percentage the best?
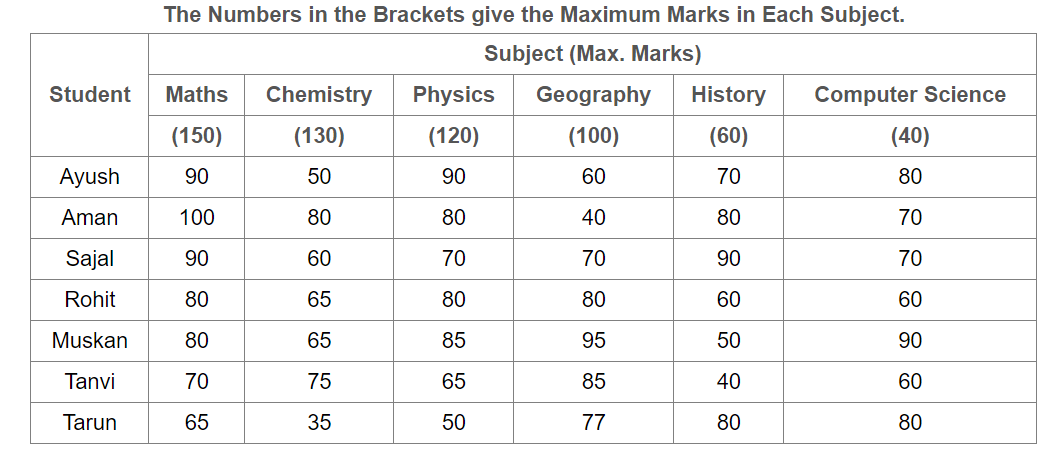
What is the overall percentage of Tarun?

What is the different between the number of students passed with 30 as cut-off marks in Chemistry and those passed with 30 as cut-off marks in aggregate?

If at least 60% marks in Physics are required for pursuing higher studies in Physics, how many students will be eligible to pursue higher studies in Physics?
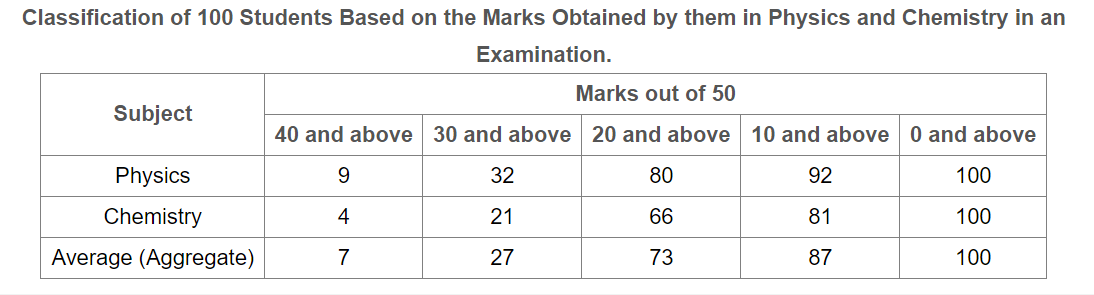
The percentage of number of students getting at least 60% marks in Chemistry over those getting at least 40% marks in aggregate, is approximately?

The number of students scoring less than 40% marks in aggregate is?
