Table Charts MCQs
Welcome to our comprehensive collection of Multiple Choice Questions (MCQs) on Table Charts, a fundamental topic in the field of Data Interpretation. Whether you're preparing for competitive exams, honing your problem-solving skills, or simply looking to enhance your abilities in this field, our Table Charts MCQs are designed to help you grasp the core concepts and excel in solving problems.
In this section, you'll find a wide range of Table Charts mcq questions that explore various aspects of Table Charts problems. Each MCQ is crafted to challenge your understanding of Table Charts principles, enabling you to refine your problem-solving techniques. Whether you're a student aiming to ace Data Interpretation tests, a job seeker preparing for interviews, or someone simply interested in sharpening their skills, our Table Charts MCQs are your pathway to success in mastering this essential Data Interpretation topic.
Note: Each of the following question comes with multiple answer choices. Select the most appropriate option and test your understanding of Table Charts. You can click on an option to test your knowledge before viewing the solution for a MCQ. Happy learning!
So, are you ready to put your Table Charts knowledge to the test? Let's get started with our carefully curated MCQs!
Table Charts MCQs | Page 3 of 5
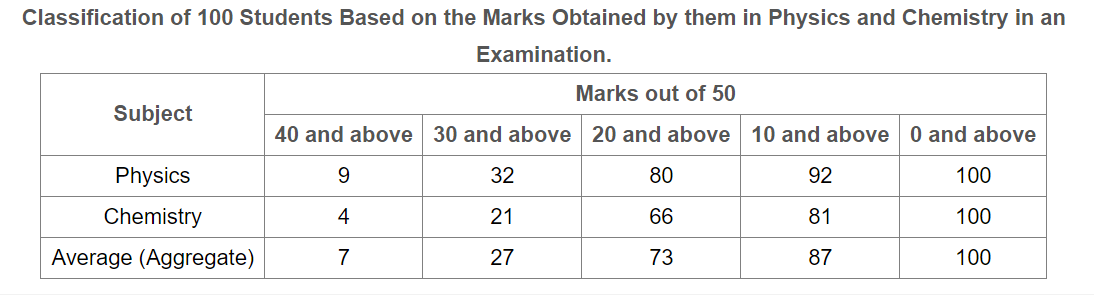
If it is known that at least 23 students were eligible for a Symposium on Chemistry, then the minimum qualifying marks in Chemistry for eligibility to Symposium would lie in the range?
For which state the average number of candidates selected over the years is the maximum?

The percentage of candidates qualified from Punjab over those appeared from Punjab is highest in the year?

In the year 1997, which state had the lowest percentage of candidates selected over the candidates appeared?
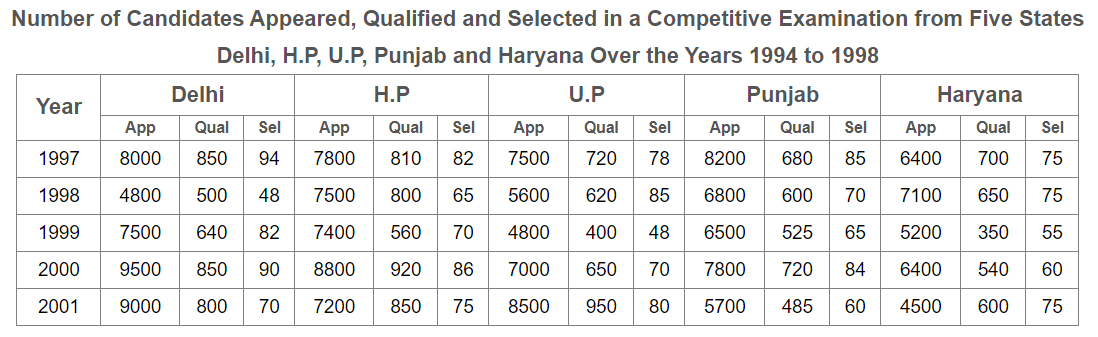
The number of candidates selected from Haryana during the period under review is approximately what percent of the number selected from Delhi during this period?

The percentage of candidates selected from U.P over those qualified from U.P is highest in the year?

What is the approximate percentage of total number of candidates selected to the total number of candidates qualified for all five states together during the year 1999?

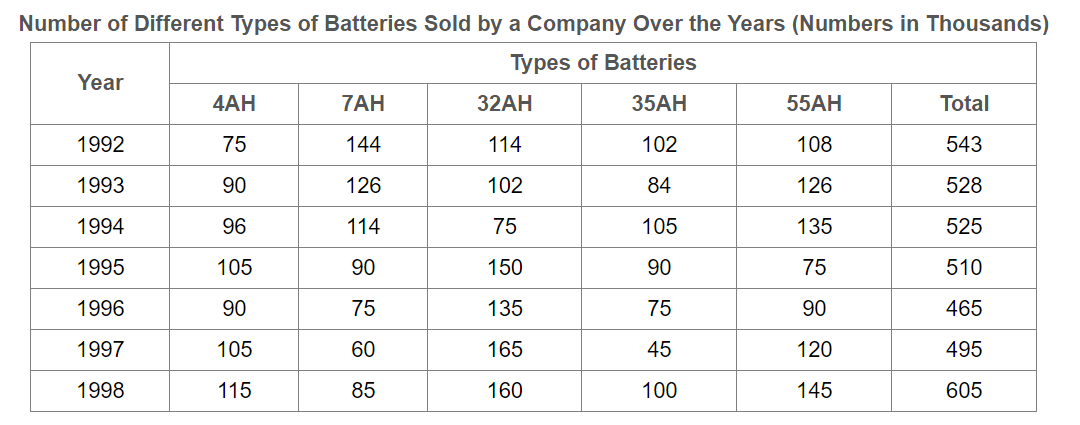
What was the approximate percentage increase in the sales of 55AH batteries in 1998 compared to that in 1992?

The total sales of all the seven years is the maximum for which battery?

What is the difference in the number of 35AH batteries sold in 1993 and 1997?