Pie Charts MCQs
Welcome to our comprehensive collection of Multiple Choice Questions (MCQs) on Pie Charts, a fundamental topic in the field of Data Interpretation. Whether you're preparing for competitive exams, honing your problem-solving skills, or simply looking to enhance your abilities in this field, our Pie Charts MCQs are designed to help you grasp the core concepts and excel in solving problems.
In this section, you'll find a wide range of Pie Charts mcq questions that explore various aspects of Pie Charts problems. Each MCQ is crafted to challenge your understanding of Pie Charts principles, enabling you to refine your problem-solving techniques. Whether you're a student aiming to ace Data Interpretation tests, a job seeker preparing for interviews, or someone simply interested in sharpening their skills, our Pie Charts MCQs are your pathway to success in mastering this essential Data Interpretation topic.
Note: Each of the following question comes with multiple answer choices. Select the most appropriate option and test your understanding of Pie Charts. You can click on an option to test your knowledge before viewing the solution for a MCQ. Happy learning!
So, are you ready to put your Pie Charts knowledge to the test? Let's get started with our carefully curated MCQs!
Pie Charts MCQs | Page 1 of 6
If for a certain quantity of books, the publisher has to pay Rs. 30,600 as printing cost, then what will be amount of royalty to be paid for these books?

What is the central angle of the sector corresponding to the expenditure incurred on Royalty?

The price of the book is marked 20% above the C.P. If the marked price of the book is Rs. 180, then what is the cost of the paper used in a single copy of the book?

If 5500 copies are published and the transportation cost on them amounts to Rs. 82500, then what should be the selling price of the book so that the publisher can earn a profit of 25%?

Royalty on the book is less than the printing cost by:

If the difference between the two expenditures are represented by 18° in the pie-chart, then these expenditures possibly are

For an edition of 12,500 copies, the amount of Royalty paid by the publisher is Rs. 2,81,250. What should be the selling price of the book if the publisher desires a profit of 5%?
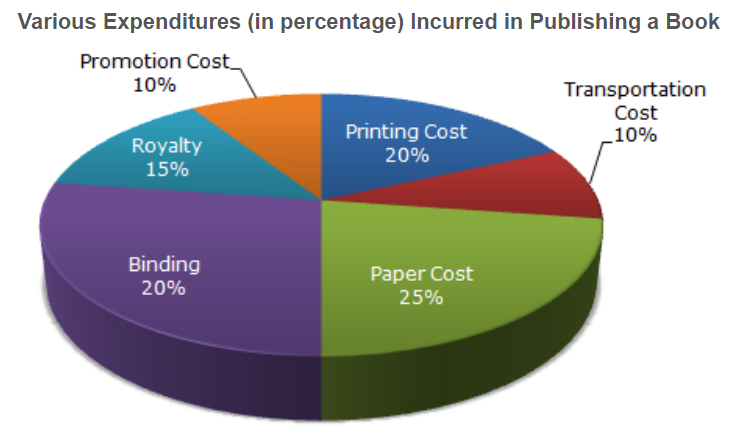
If for an edition of the book, the cost of paper is Rs. 56250, then find the promotion cost for this edition.

Which two expenditures together have central angle of 108°?

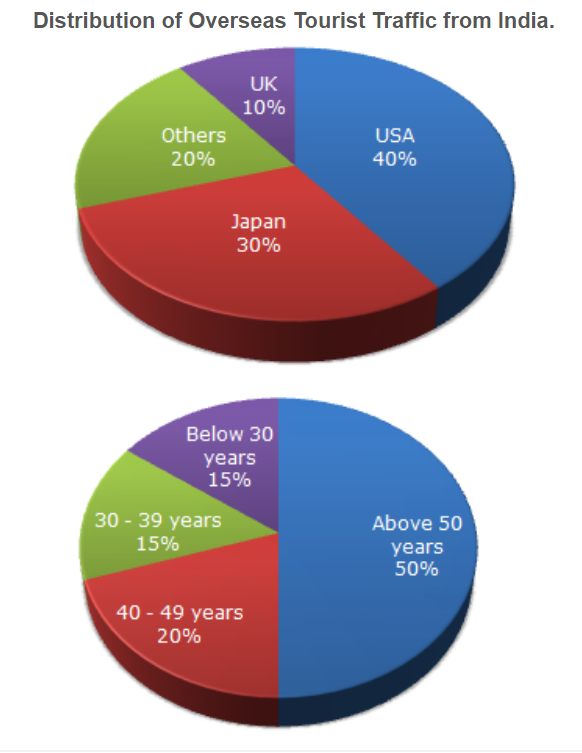
What percentage of Indian tourist went to either USA or UK ?