Table Charts MCQs
Welcome to our comprehensive collection of Multiple Choice Questions (MCQs) on Table Charts, a fundamental topic in the field of Data Interpretation. Whether you're preparing for competitive exams, honing your problem-solving skills, or simply looking to enhance your abilities in this field, our Table Charts MCQs are designed to help you grasp the core concepts and excel in solving problems.
In this section, you'll find a wide range of Table Charts mcq questions that explore various aspects of Table Charts problems. Each MCQ is crafted to challenge your understanding of Table Charts principles, enabling you to refine your problem-solving techniques. Whether you're a student aiming to ace Data Interpretation tests, a job seeker preparing for interviews, or someone simply interested in sharpening their skills, our Table Charts MCQs are your pathway to success in mastering this essential Data Interpretation topic.
Note: Each of the following question comes with multiple answer choices. Select the most appropriate option and test your understanding of Table Charts. You can click on an option to test your knowledge before viewing the solution for a MCQ. Happy learning!
So, are you ready to put your Table Charts knowledge to the test? Let's get started with our carefully curated MCQs!
Table Charts MCQs | Page 1 of 5
What is the average amount of interest per year which the company had to pay during this period?

The total amount of bonus paid by the company during the given period is approximately what percent of the total amount of salary paid during this period?

Total expenditure on all these items in 1998 was approximately what percent of the total expenditure in 2002?
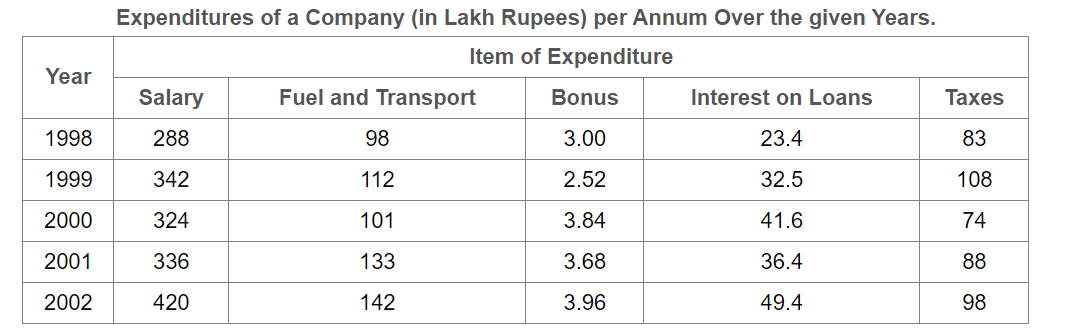
The total expenditure of the company over these items during the year 2000 is?

The ratio between the total expenditure on Taxes for all the years and the total expenditure on Fuel and Transport for all the years respectively is approximately?

Total number of candidates qualified from all the states together in 1997 is approximately what percentage of the total number of candidates qualified from all the states together in 1998?

What is the average candidates who appeared from State Q during the given years?
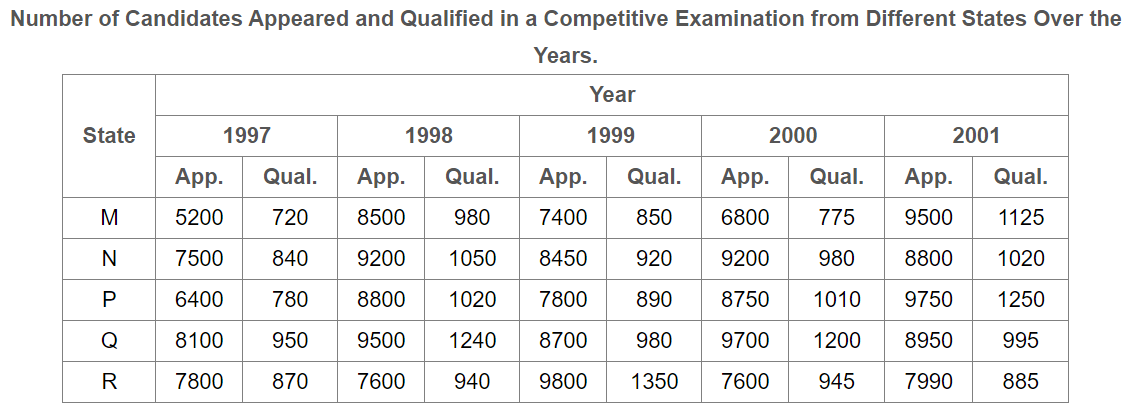
In which of the given years the number of candidates appeared from State P has maximum percentage of qualified candidates?

What is the percentage of candidates qualified from State N for all the years together, over the candidates appeared from State N during all the years together?

The percentage of total number of qualified candidates to the total number of appeared candidates among all the five states in 1999 is?
