Table Charts MCQs
Welcome to our comprehensive collection of Multiple Choice Questions (MCQs) on Table Charts, a fundamental topic in the field of Data Interpretation. Whether you're preparing for competitive exams, honing your problem-solving skills, or simply looking to enhance your abilities in this field, our Table Charts MCQs are designed to help you grasp the core concepts and excel in solving problems.
In this section, you'll find a wide range of Table Charts mcq questions that explore various aspects of Table Charts problems. Each MCQ is crafted to challenge your understanding of Table Charts principles, enabling you to refine your problem-solving techniques. Whether you're a student aiming to ace Data Interpretation tests, a job seeker preparing for interviews, or someone simply interested in sharpening their skills, our Table Charts MCQs are your pathway to success in mastering this essential Data Interpretation topic.
Note: Each of the following question comes with multiple answer choices. Select the most appropriate option and test your understanding of Table Charts. You can click on an option to test your knowledge before viewing the solution for a MCQ. Happy learning!
So, are you ready to put your Table Charts knowledge to the test? Let's get started with our carefully curated MCQs!
Table Charts MCQs | Page 5 of 5
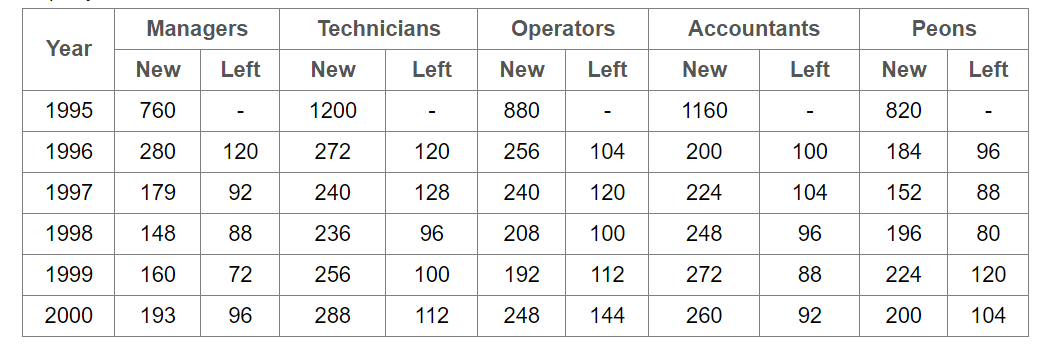
What is the pooled average of the total number of employees of all categories in the year 1997?

During the period between 1995 and 2000, the total number of Operators who left the Company is what percent of total number of Operators who joined the Company?
If the male population above poverty line for State R is 1.9 million, then the total population of State R is?

What will be the number of females above the poverty line in the State S if it is known that the population of State S is 7 million?

What will be the male population above poverty line for State P if the female population below poverty line for State P is 2.1 million?
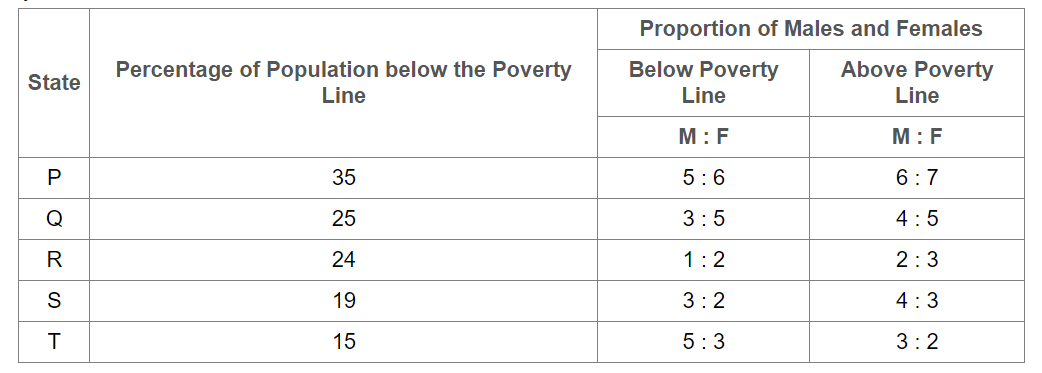
If the population of males below poverty line for State Q is 2.4 million and that for State T is 6 million, then the total populations of States Q and T are in the ratio?
