Pie Charts MCQs
Welcome to our comprehensive collection of Multiple Choice Questions (MCQs) on Pie Charts, a fundamental topic in the field of Data Interpretation. Whether you're preparing for competitive exams, honing your problem-solving skills, or simply looking to enhance your abilities in this field, our Pie Charts MCQs are designed to help you grasp the core concepts and excel in solving problems.
In this section, you'll find a wide range of Pie Charts mcq questions that explore various aspects of Pie Charts problems. Each MCQ is crafted to challenge your understanding of Pie Charts principles, enabling you to refine your problem-solving techniques. Whether you're a student aiming to ace Data Interpretation tests, a job seeker preparing for interviews, or someone simply interested in sharpening their skills, our Pie Charts MCQs are your pathway to success in mastering this essential Data Interpretation topic.
Note: Each of the following question comes with multiple answer choices. Select the most appropriate option and test your understanding of Pie Charts. You can click on an option to test your knowledge before viewing the solution for a MCQ. Happy learning!
So, are you ready to put your Pie Charts knowledge to the test? Let's get started with our carefully curated MCQs!
Pie Charts MCQs | Page 5 of 6
If the total amount spent on sports during the year be Rs. 1,80,00,000 , the amount spent on Basketball exceeds on Tennis by:

How much percent less is spent on Football than that on Cricket?
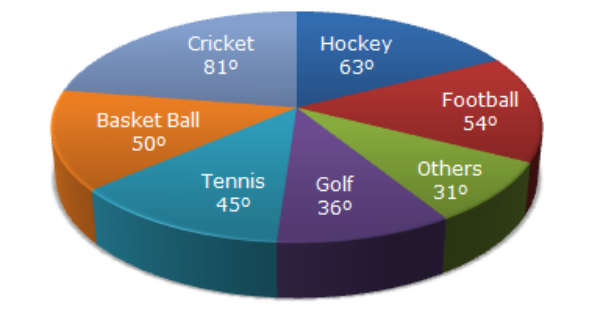
If the total amount spent on sports during the year was Rs. 2 crores, the amount spent on Cricket and Hockey together was:

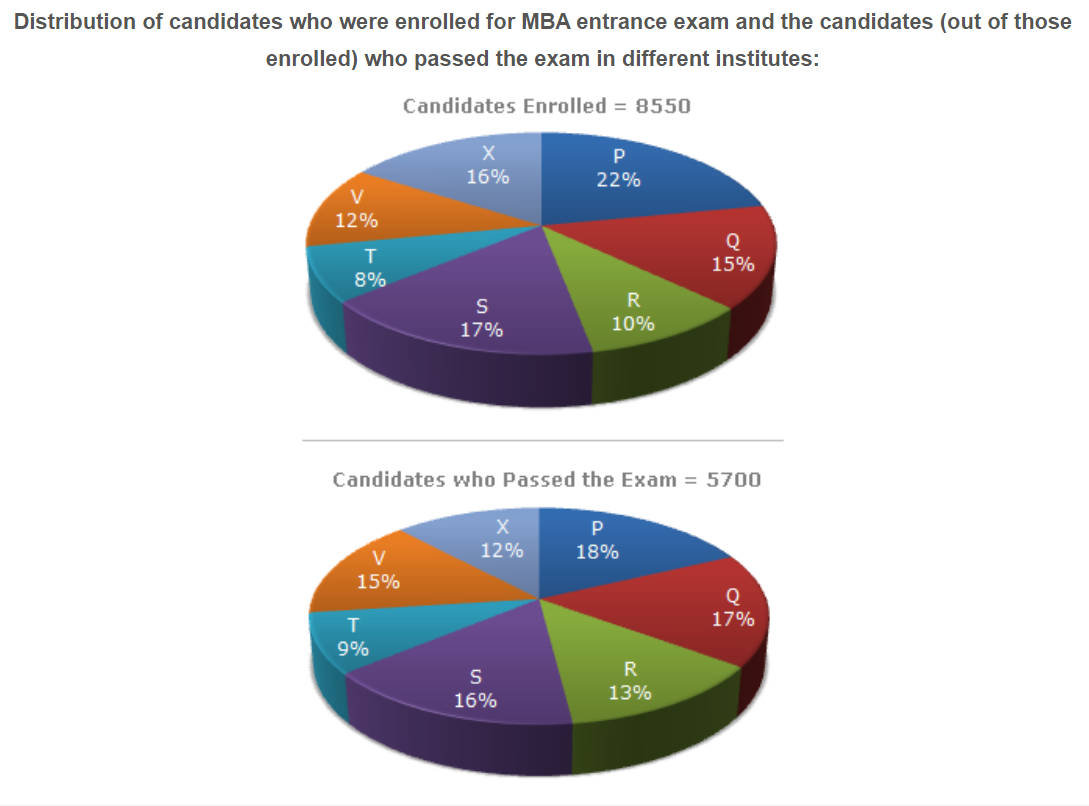
What percentage of candidates passed the Exam from institute T out of the total number of candidates enrolled from the same institute?

Which institute has the highest percentage of candidates passed to the candidates enrolled?

The number of candidates passed from institutes S and P together exceeds the number of candidates enrolled from institutes T and R together by:

What is the percentage of candidates passed to the candidates enrolled for institutes Q and R together?

What is the ratio of candidates passed to the candidates enrolled from institute P?
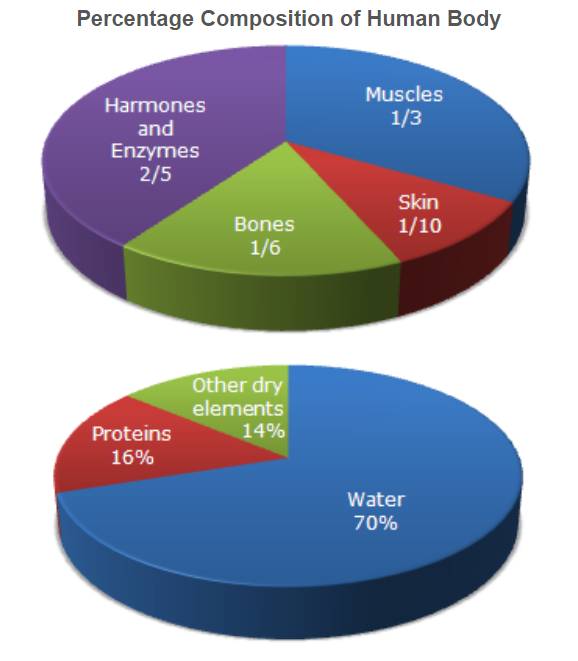
What percent of the total weight of human body is equivalent to the weight of the proteins in skin in human body?

What will be the quantity of water in the body of a person weighing 50 kg?