Pie Charts MCQs
Welcome to our comprehensive collection of Multiple Choice Questions (MCQs) on Pie Charts, a fundamental topic in the field of Data Interpretation. Whether you're preparing for competitive exams, honing your problem-solving skills, or simply looking to enhance your abilities in this field, our Pie Charts MCQs are designed to help you grasp the core concepts and excel in solving problems.
In this section, you'll find a wide range of Pie Charts mcq questions that explore various aspects of Pie Charts problems. Each MCQ is crafted to challenge your understanding of Pie Charts principles, enabling you to refine your problem-solving techniques. Whether you're a student aiming to ace Data Interpretation tests, a job seeker preparing for interviews, or someone simply interested in sharpening their skills, our Pie Charts MCQs are your pathway to success in mastering this essential Data Interpretation topic.
Note: Each of the following question comes with multiple answer choices. Select the most appropriate option and test your understanding of Pie Charts. You can click on an option to test your knowledge before viewing the solution for a MCQ. Happy learning!
So, are you ready to put your Pie Charts knowledge to the test? Let's get started with our carefully curated MCQs!
Pie Charts MCQs | Page 2 of 6
The ratio of the number of Indian tourists that went to USA to the number of Indian tourists who were below 30 years of age is ?
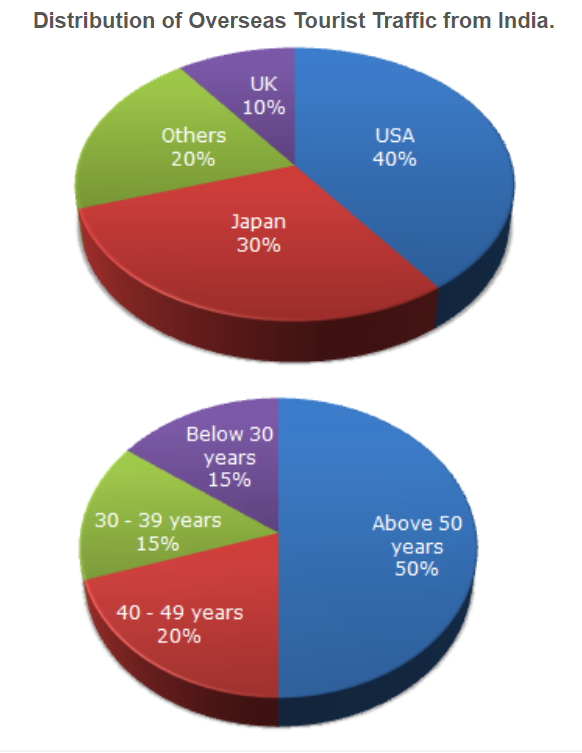
If amongst other countries, Switzerland accounted for 25% of the Indian tourist traffic, and it is known from official Swiss records that a total of 25 lakh Indian tourists had gone to Switzerland during the year, then find the number of 30-39 year old Indian tourists who went abroad in that year ?

What percentage of proteins of the human body is equivalent to the weight of its skin ?

How much of the human body is neither made of bones or skin ?
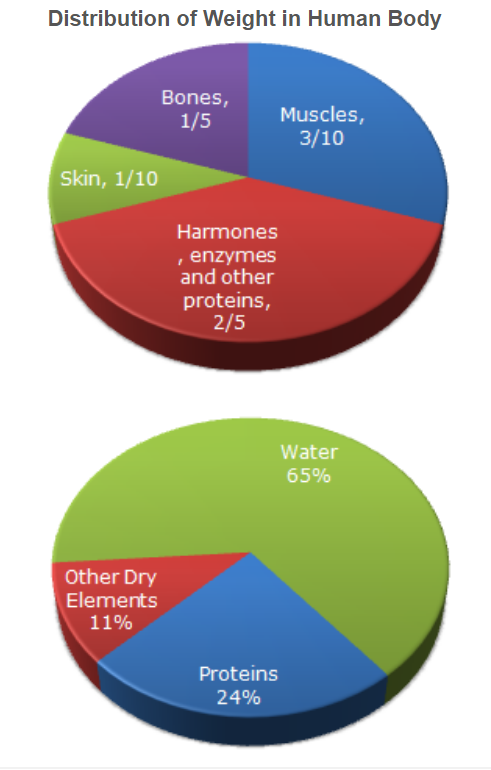
What is the ratio of the distribution of proteins in the muscles to that of the distribution of proteins in the bones ?

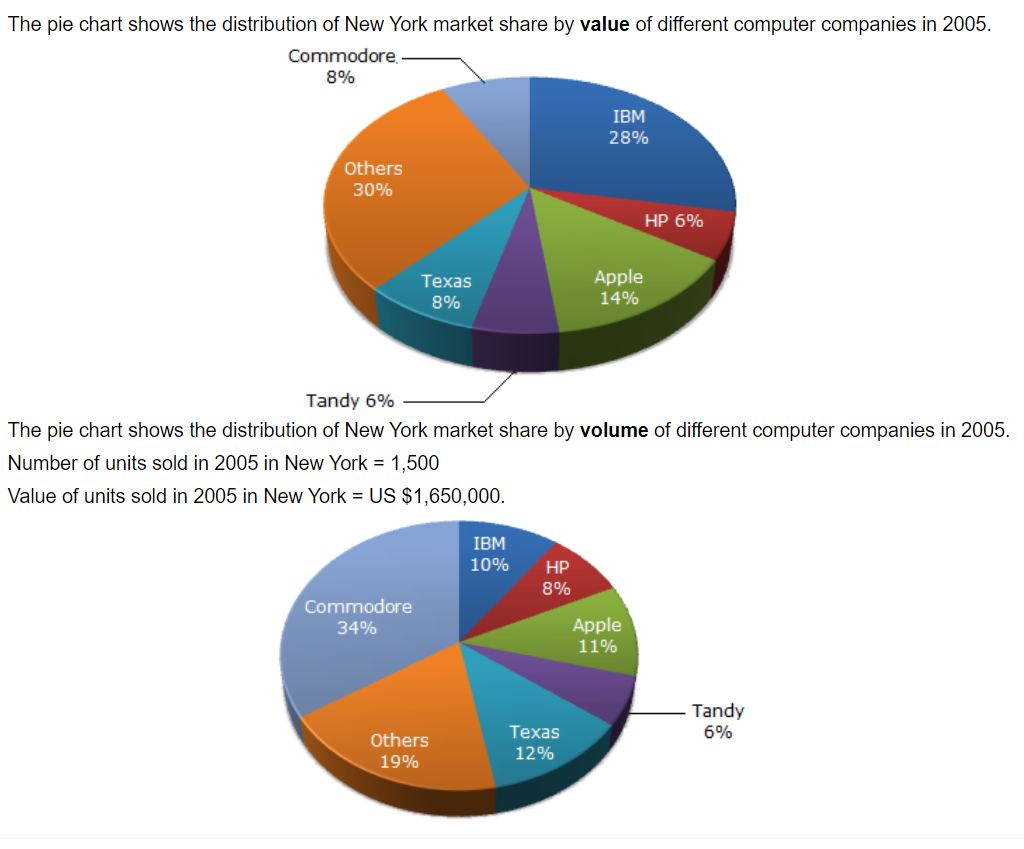
For the year 2005, which company has realised the lowest average unit sales price for a PC ?

Over the period 2005-2006, if sales (value-wise) of IBM PC's increased by 50% and of Apple by 15% assuming that PC sales of all other computer companies remained the same, by what percentage (approximately) would the PC sales in New York (value-wise) increase over the same period ?

In 2005, the average unit sale price of an IBM PC was approximately (in US$)
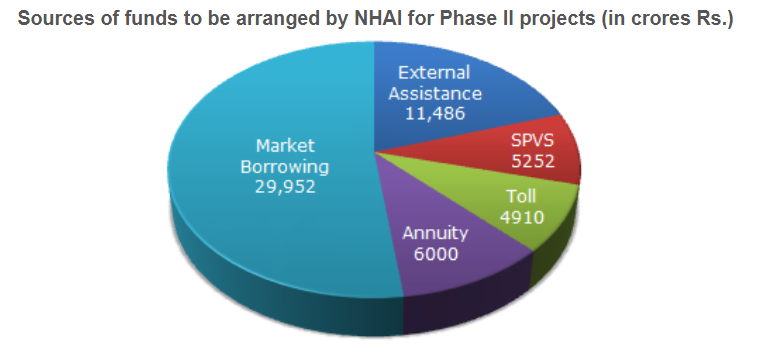
Near about 20% of the funds are to be arranged through:

If NHAI could receive a total of Rs. 9695 crores as External Assistance, by what percent (approximately) should it increase the Market Borrowing to arrange for the shortage of funds?