Pie Charts MCQs
Welcome to our comprehensive collection of Multiple Choice Questions (MCQs) on Pie Charts, a fundamental topic in the field of Data Interpretation. Whether you're preparing for competitive exams, honing your problem-solving skills, or simply looking to enhance your abilities in this field, our Pie Charts MCQs are designed to help you grasp the core concepts and excel in solving problems.
In this section, you'll find a wide range of Pie Charts mcq questions that explore various aspects of Pie Charts problems. Each MCQ is crafted to challenge your understanding of Pie Charts principles, enabling you to refine your problem-solving techniques. Whether you're a student aiming to ace Data Interpretation tests, a job seeker preparing for interviews, or someone simply interested in sharpening their skills, our Pie Charts MCQs are your pathway to success in mastering this essential Data Interpretation topic.
Note: Each of the following question comes with multiple answer choices. Select the most appropriate option and test your understanding of Pie Charts. You can click on an option to test your knowledge before viewing the solution for a MCQ. Happy learning!
So, are you ready to put your Pie Charts knowledge to the test? Let's get started with our carefully curated MCQs!
Pie Charts MCQs | Page 6 of 6
What is the ratio of the distribution of proteins in the muscles to that of the distribution of proteins in the bones?

To show the distribution of proteins and other dry elements in the human body, the arc of the circle should subtend at the centre an angle of:
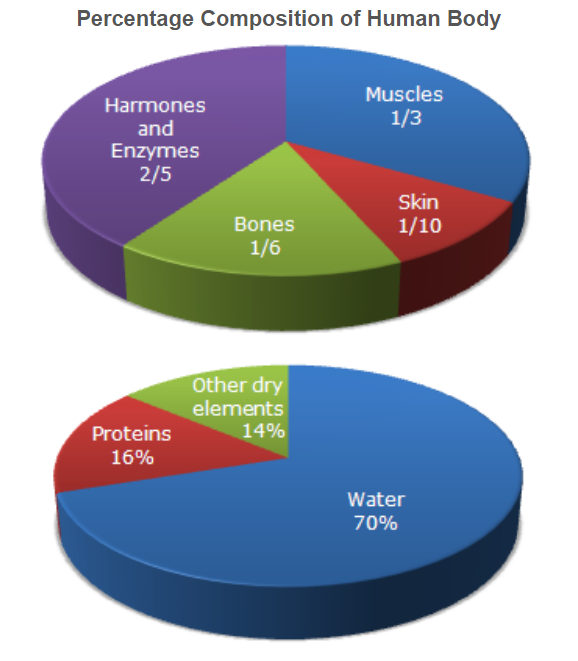
In the human body, what part is made of neither bones nor skin?

What will be the percentage of total number of males in U.P., M.P. and Goa together to the total population of all the given states?
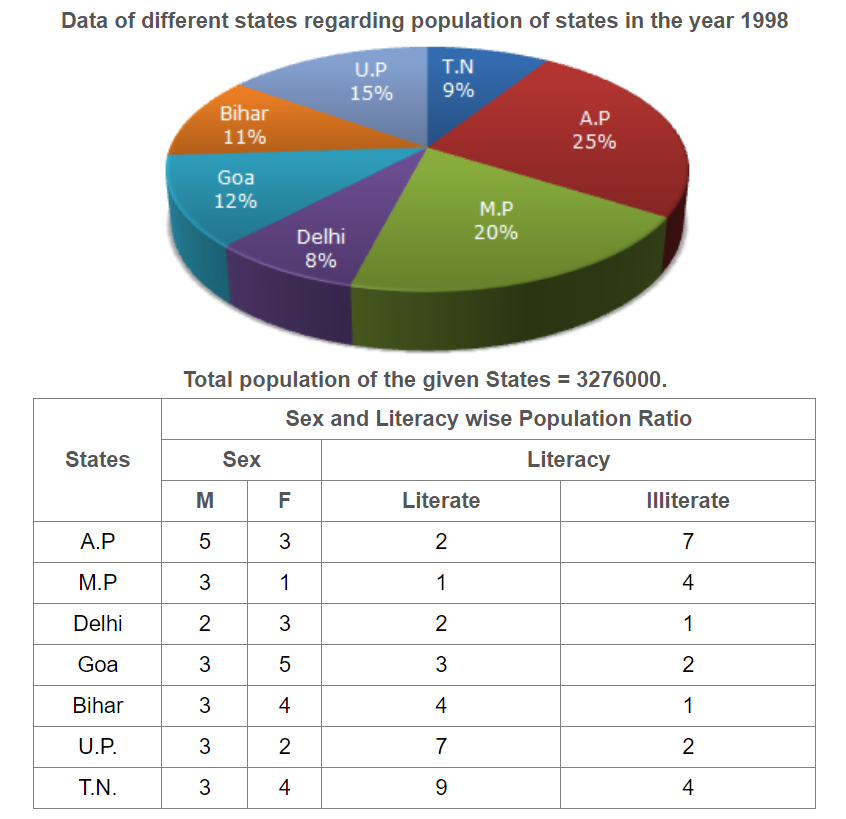
What was the total number of illiterate people in A.P. and M.P. in 1998?

What is the ratio of the number of females in T.N. to the number of females in Delhi?

What was the number of males in U.P. in the year 1998?

If in the year 1998, there was an increase of 10% in the population of U.P. and 12% in the population of M.P. compared to the previous year, then what was the ratio of populations of U.P. and M.P. in 1997?
