Pie Charts MCQs
Welcome to our comprehensive collection of Multiple Choice Questions (MCQs) on Pie Charts, a fundamental topic in the field of Data Interpretation. Whether you're preparing for competitive exams, honing your problem-solving skills, or simply looking to enhance your abilities in this field, our Pie Charts MCQs are designed to help you grasp the core concepts and excel in solving problems.
In this section, you'll find a wide range of Pie Charts mcq questions that explore various aspects of Pie Charts problems. Each MCQ is crafted to challenge your understanding of Pie Charts principles, enabling you to refine your problem-solving techniques. Whether you're a student aiming to ace Data Interpretation tests, a job seeker preparing for interviews, or someone simply interested in sharpening their skills, our Pie Charts MCQs are your pathway to success in mastering this essential Data Interpretation topic.
Note: Each of the following question comes with multiple answer choices. Select the most appropriate option and test your understanding of Pie Charts. You can click on an option to test your knowledge before viewing the solution for a MCQ. Happy learning!
So, are you ready to put your Pie Charts knowledge to the test? Let's get started with our carefully curated MCQs!
Pie Charts MCQs | Page 3 of 6
If the toll is to be collected through an outsourced agency by allowing a maximum 10% commission, how much amount should be permitted to be collected by the outsourced agency, so that the project is supported with Rs. 4910 crores?

The central angle corresponding to Market Borrowing is
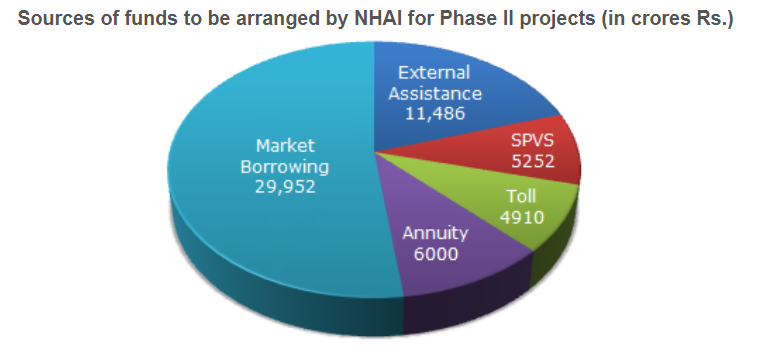
The approximate ratio of the funds to be arranged through Toll and that through Market Borrowing is

What is the total number of graduate and post-graduate level students is institute R?

What is the ratio between the number of students studying at post-graduate and graduate levels respectively from institute S?

How many students of institutes of M and S are studying at graduate level?

What is the ratio between the number of students studying at post-graduate level from institutes S and the number of students studying at graduate level from institute Q?
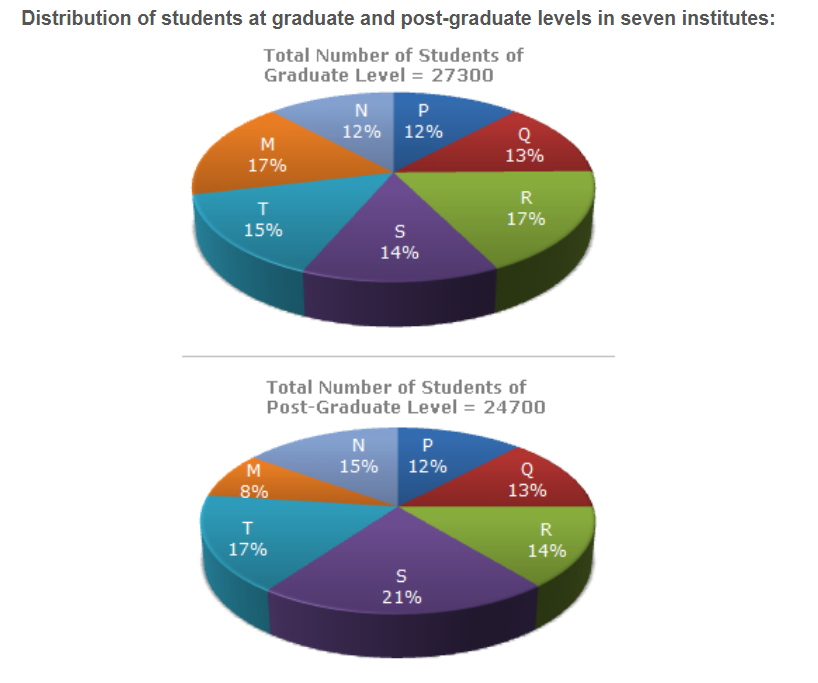
Total number of students studying at post-graduate level from institutes N and P is

If the population of village R in 1997 is 32000, then what will be the population of village Y below poverty line in that year?
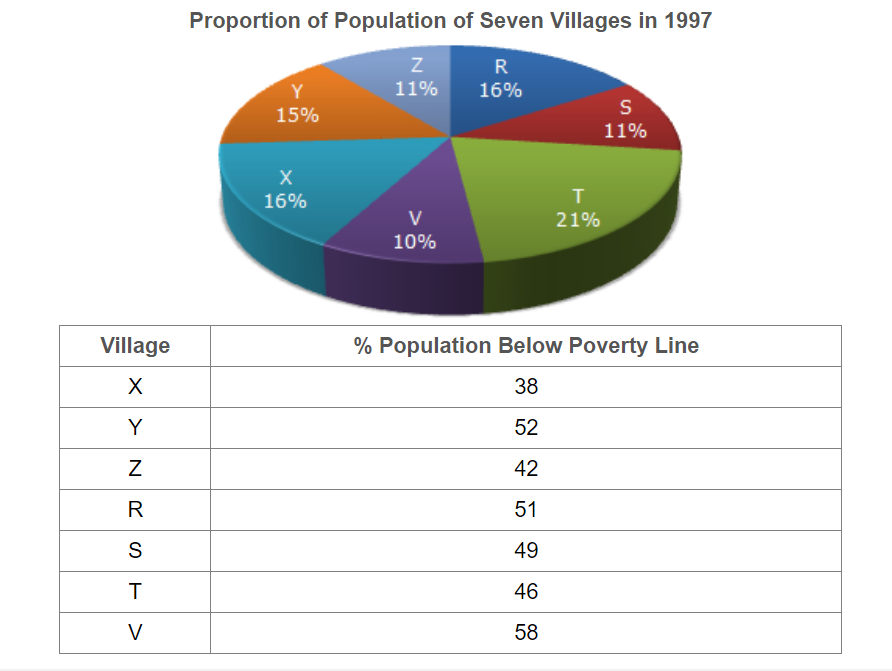
The ratio of population of village T below poverty line to that of village Z below poverty line in 1997 is:
