Pie Charts MCQs
Welcome to our comprehensive collection of Multiple Choice Questions (MCQs) on Pie Charts, a fundamental topic in the field of Data Interpretation. Whether you're preparing for competitive exams, honing your problem-solving skills, or simply looking to enhance your abilities in this field, our Pie Charts MCQs are designed to help you grasp the core concepts and excel in solving problems.
In this section, you'll find a wide range of Pie Charts mcq questions that explore various aspects of Pie Charts problems. Each MCQ is crafted to challenge your understanding of Pie Charts principles, enabling you to refine your problem-solving techniques. Whether you're a student aiming to ace Data Interpretation tests, a job seeker preparing for interviews, or someone simply interested in sharpening their skills, our Pie Charts MCQs are your pathway to success in mastering this essential Data Interpretation topic.
Note: Each of the following question comes with multiple answer choices. Select the most appropriate option and test your understanding of Pie Charts. You can click on an option to test your knowledge before viewing the solution for a MCQ. Happy learning!
So, are you ready to put your Pie Charts knowledge to the test? Let's get started with our carefully curated MCQs!
Pie Charts MCQs | Page 4 of 6
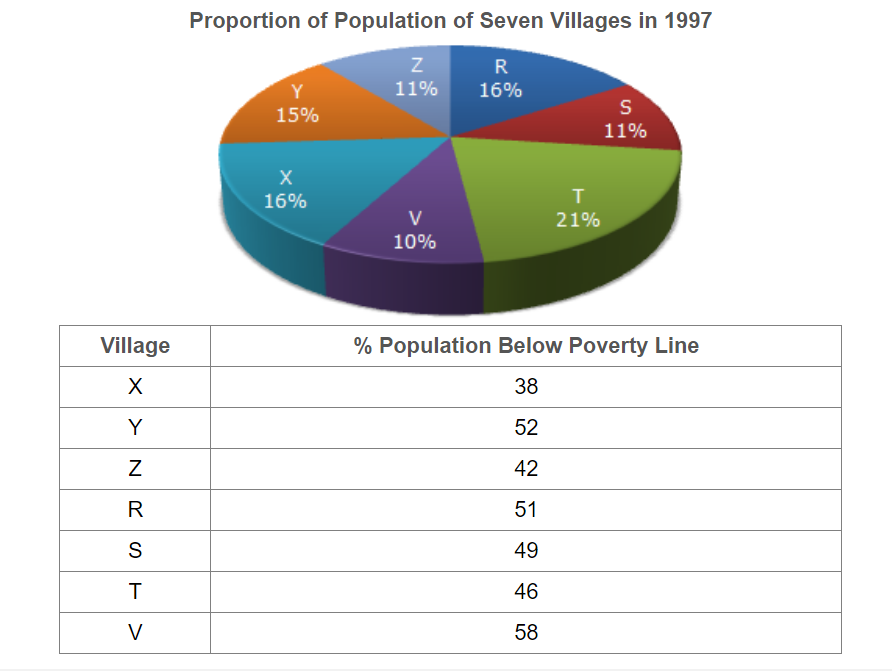
Find the population of village S if the population of village X below poverty line in 1997 is 12160.

If in 1998, the population of villages Y and V increase by 10% each and the percentage of population below poverty line remains unchanged for all the villages, then find the population of village V below poverty line in 1998, given that the population of village Y in 1997 was 30000.
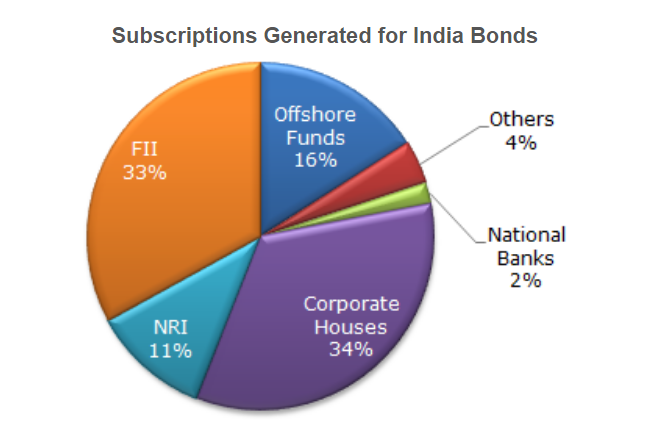
In the corporate sector, approximately how many degrees should be there in the central angle ?

If the investment by NRI's are Rs 4,000 crore, then the investments by corporate houses and FII's together is:

What percentage of the total investment is coming from FII's and NRI's ?

If the total investment other than by FII and corporate houses is Rs 335,000 crore, then the investment by NRI's and Offshore funds will be (approximately) ?

If the total investment flows from FII's were to be doubled in the next year and the investment flows from all other sources had remained constant at their existing levels for this year, then what would be the proportion of FII investment in the total investment into India Bonds next year (in US $ millions) ?

What is the approximate ratio of investment flows into India Bonds from NRI's to corporate houses ?
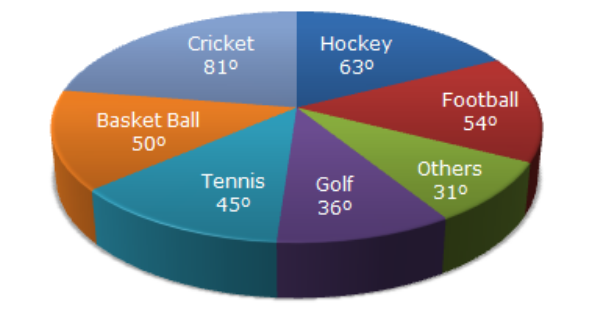
What percent of total spending is spent on Tennis?

How much percent more is spent on Hockey than that on Golf?