Line Charts MCQs
Welcome to our comprehensive collection of Multiple Choice Questions (MCQs) on Line Charts, a fundamental topic in the field of Data Interpretation. Whether you're preparing for competitive exams, honing your problem-solving skills, or simply looking to enhance your abilities in this field, our Line Charts MCQs are designed to help you grasp the core concepts and excel in solving problems.
In this section, you'll find a wide range of Line Charts mcq questions that explore various aspects of Line Charts problems. Each MCQ is crafted to challenge your understanding of Line Charts principles, enabling you to refine your problem-solving techniques. Whether you're a student aiming to ace Data Interpretation tests, a job seeker preparing for interviews, or someone simply interested in sharpening their skills, our Line Charts MCQs are your pathway to success in mastering this essential Data Interpretation topic.
Note: Each of the following question comes with multiple answer choices. Select the most appropriate option and test your understanding of Line Charts. You can click on an option to test your knowledge before viewing the solution for a MCQ. Happy learning!
So, are you ready to put your Line Charts knowledge to the test? Let's get started with our carefully curated MCQs!
Line Charts MCQs | Page 3 of 6
The difference between the percentage of candidates qualified to appeared was maximum in which of the following pairs of years?

In which pair of years was the number of candidates qualified, the same?

If the number of candidates qualified in 1998 was 21200, what was the number of candidates appeared in 1998?

If the total number of candidates appeared in 1996 and 1997 together was 47400, then the total number of candidates qualified in these two years together was?
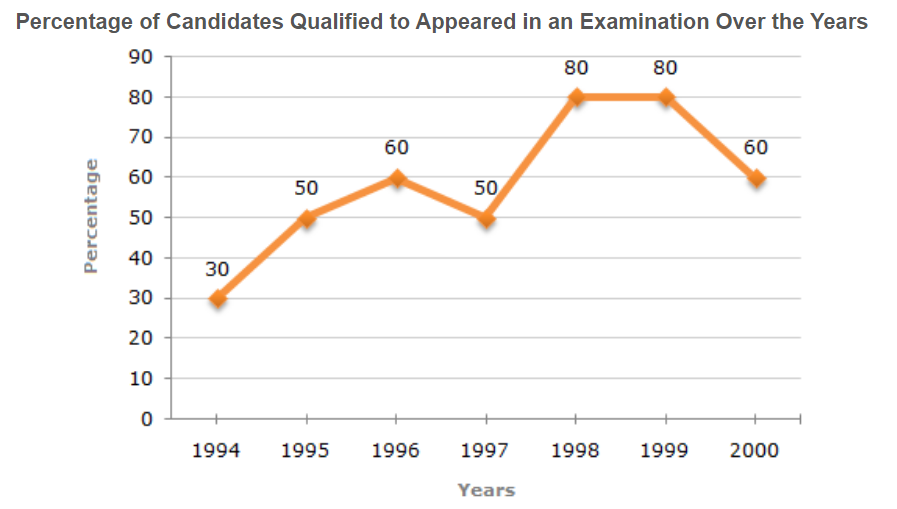
The total number of candidates qualified in 1999 and 2000 together was 33500 and the number of candidates appeared in 1999 was 26500. What was the number of candidates in 2000?

If the expenditures in 1996 and 1999 are equal, then the approximate ratio of the income in 1996 and 1999 respectively is?

If the income in 1998 was Rs. 264 crores, what was the expenditure in 1998?

In which year is the expenditure minimum?

If the profit in 1999 was Rs. 4 crores, what was the profit in 2000?
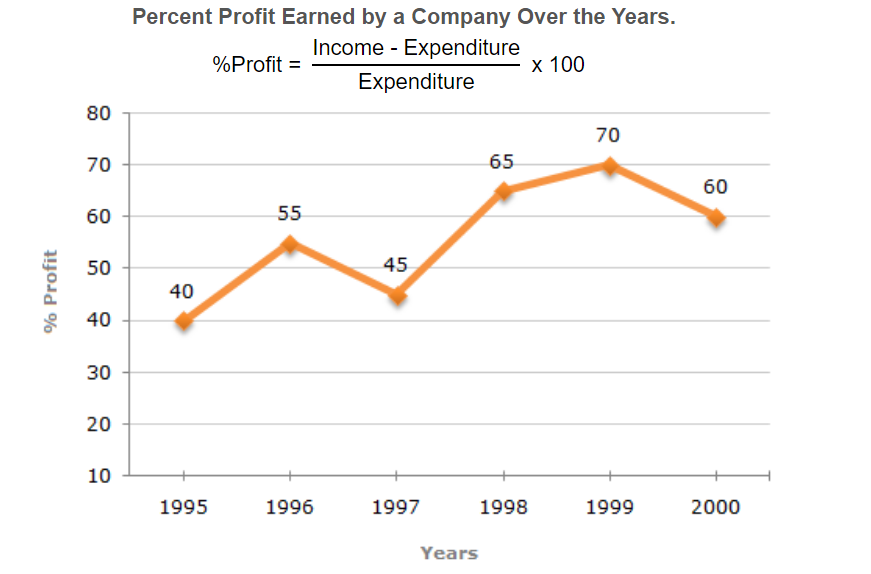
What is the average profit earned for the given years?
