Line Charts MCQs
Welcome to our comprehensive collection of Multiple Choice Questions (MCQs) on Line Charts, a fundamental topic in the field of Data Interpretation. Whether you're preparing for competitive exams, honing your problem-solving skills, or simply looking to enhance your abilities in this field, our Line Charts MCQs are designed to help you grasp the core concepts and excel in solving problems.
In this section, you'll find a wide range of Line Charts mcq questions that explore various aspects of Line Charts problems. Each MCQ is crafted to challenge your understanding of Line Charts principles, enabling you to refine your problem-solving techniques. Whether you're a student aiming to ace Data Interpretation tests, a job seeker preparing for interviews, or someone simply interested in sharpening their skills, our Line Charts MCQs are your pathway to success in mastering this essential Data Interpretation topic.
Note: Each of the following question comes with multiple answer choices. Select the most appropriate option and test your understanding of Line Charts. You can click on an option to test your knowledge before viewing the solution for a MCQ. Happy learning!
So, are you ready to put your Line Charts knowledge to the test? Let's get started with our carefully curated MCQs!
Line Charts MCQs | Page 4 of 6
During which of the following year was the ratio of income to the expenditure the minimum?
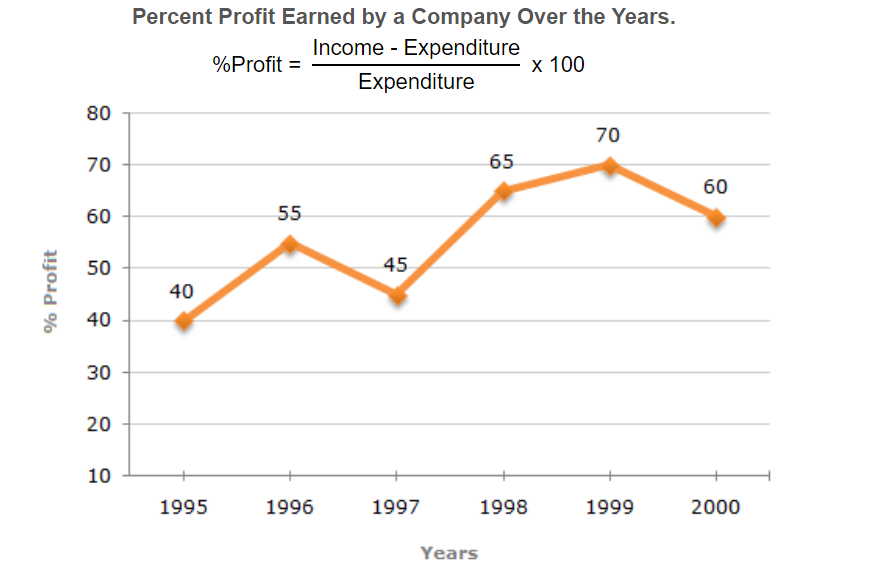
During which year the ratio of percentage profit earned to that in the previous year is the minimum?

If the expenditure in 2000 is 25% more than expenditure in 1997, then the income in 1997 is what percent less than the income in 2000?

In how many of the given years were the exports more than the imports for Company A?

If the imports of Company A in 1997 were increased by 40 percent, what would be the ratio of exports to the increased imports?

If the exports of Company A in 1998 were Rs. 237 crores, what was the amount of imports in that year?

In 1995, the export of Company A was double that of Company B. If the imports of Company A during the year was Rs. 180 crores, what was the approximate amount of imports pf Company B during that year?
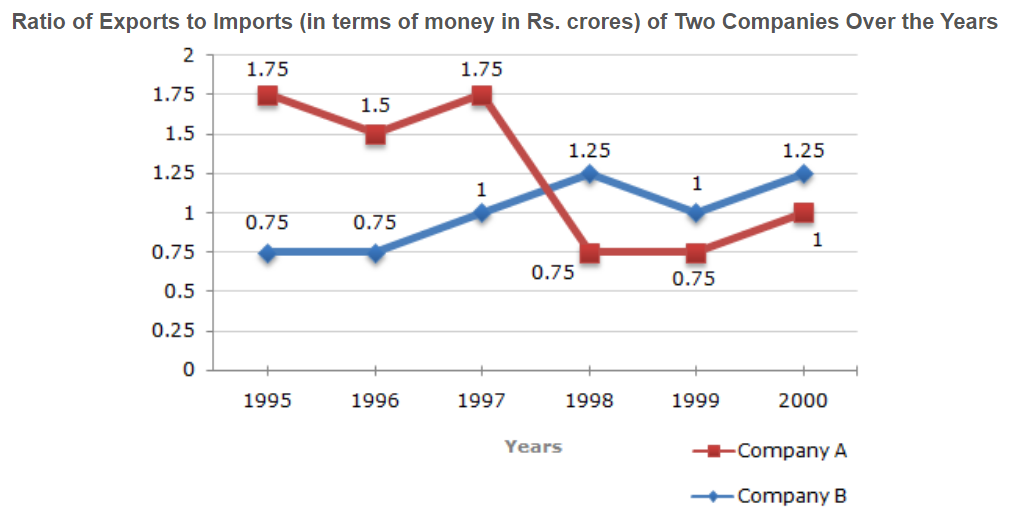
In which year(s) was the difference between imports and exports of Company B the maximum?

A sum of Rs. 4.75 lakhs was invested in Company Q in 1999 for one year. How much more interest would have been earned if the sum was invested in Company P?
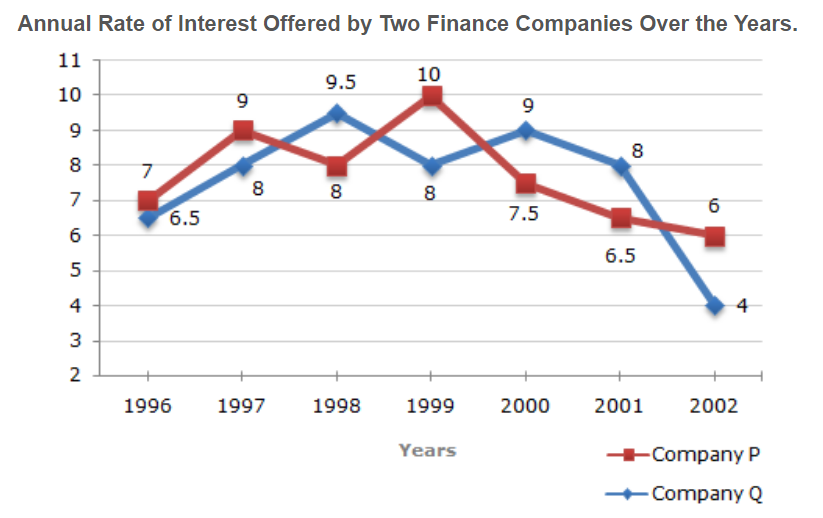
If two different amounts in the ratio 8:9 are invested in Companies P and Q respectively in 2002, then the amounts received after one year as interests from Companies P and Q are respectively in the ratio?
