Line Charts MCQs
Welcome to our comprehensive collection of Multiple Choice Questions (MCQs) on Line Charts, a fundamental topic in the field of Data Interpretation. Whether you're preparing for competitive exams, honing your problem-solving skills, or simply looking to enhance your abilities in this field, our Line Charts MCQs are designed to help you grasp the core concepts and excel in solving problems.
In this section, you'll find a wide range of Line Charts mcq questions that explore various aspects of Line Charts problems. Each MCQ is crafted to challenge your understanding of Line Charts principles, enabling you to refine your problem-solving techniques. Whether you're a student aiming to ace Data Interpretation tests, a job seeker preparing for interviews, or someone simply interested in sharpening their skills, our Line Charts MCQs are your pathway to success in mastering this essential Data Interpretation topic.
Note: Each of the following question comes with multiple answer choices. Select the most appropriate option and test your understanding of Line Charts. You can click on an option to test your knowledge before viewing the solution for a MCQ. Happy learning!
So, are you ready to put your Line Charts knowledge to the test? Let's get started with our carefully curated MCQs!
Line Charts MCQs | Page 5 of 6
In 2000, a part of Rs. 30 lakhs was invested in Company P and the rest was invested in Company Q for one year. The total interest received was Rs. 2.43 lakhs. What was the amount invested in Company P?
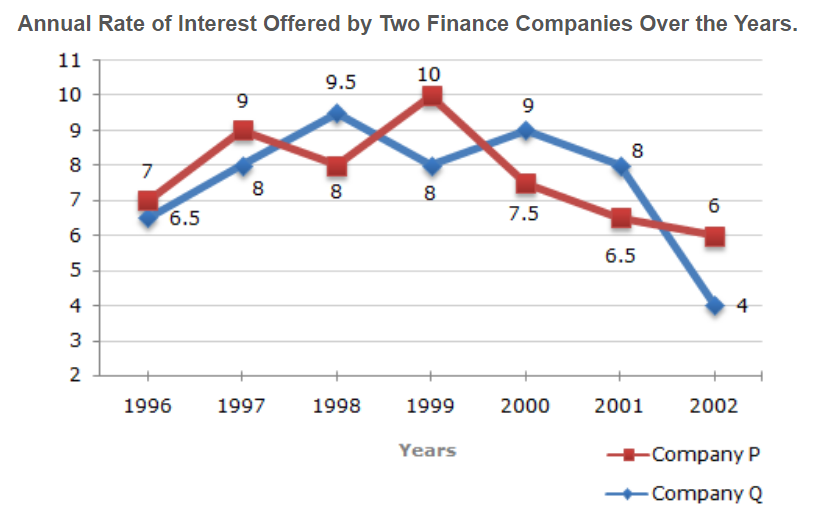
An investor invested a sum of Rs. 12 lakhs in Company P in 1998. The total amount received after one year was re-invested in the same Company for one more year. The total appreciation received by the investor on his investment was?

An investor invested Rs. 5 lakhs in Company Q in 1996. After one year, the entire amount along with the interest was transferred as investment to Company P in 1997 for one year. What amount will be received from Company P, by the investor?

The number of students studying in the school during 1999 was?

For which year, the percentage rise/fall in the number of students who left the school compared to the previous year is maximum?

The strength of school increased/decreased from 1997 to 1998 by approximately what percent?

The number of students studying in the school in 1998 was what percent of the number of students studying in the school in 2001?

The ratio of the least number of students who joined the school to the maximum number of students who left the school in any of the years during the given period is?

During which of the following pairs of years, the strength of the school was same?
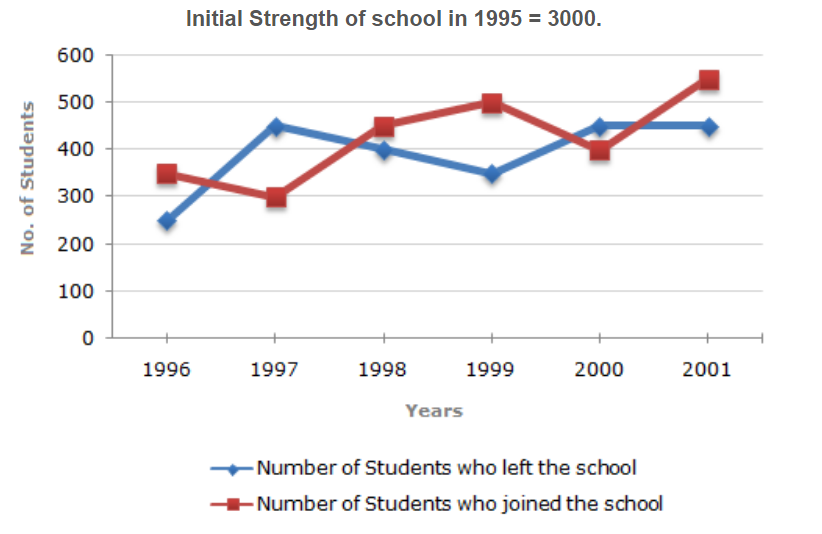
Among the given years, the largest number of students joined the school in the year?
