Bar Charts MCQs
Welcome to our comprehensive collection of Multiple Choice Questions (MCQs) on Bar Charts, a fundamental topic in the field of Data Interpretation. Whether you're preparing for competitive exams, honing your problem-solving skills, or simply looking to enhance your abilities in this field, our Bar Charts MCQs are designed to help you grasp the core concepts and excel in solving problems.
In this section, you'll find a wide range of Bar Charts mcq questions that explore various aspects of Bar Charts problems. Each MCQ is crafted to challenge your understanding of Bar Charts principles, enabling you to refine your problem-solving techniques. Whether you're a student aiming to ace Data Interpretation tests, a job seeker preparing for interviews, or someone simply interested in sharpening their skills, our Bar Charts MCQs are your pathway to success in mastering this essential Data Interpretation topic.
Note: Each of the following question comes with multiple answer choices. Select the most appropriate option and test your understanding of Bar Charts. You can click on an option to test your knowledge before viewing the solution for a MCQ. Happy learning!
So, are you ready to put your Bar Charts knowledge to the test? Let's get started with our carefully curated MCQs!
Bar Charts MCQs | Page 4 of 10
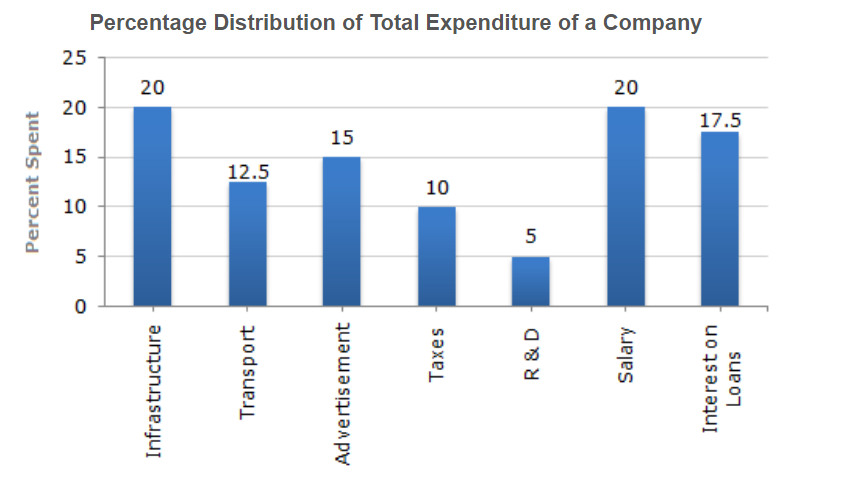
The expenditure on the interest on loans is by what percent more than the expenditure on transport?
The sales of lipsticks in 2000 was by what percent more than the sales of nail enamels in 2000? (rounded off to nearest integer)

During the period 1995-2000, the minimum rate of increase in sales is in the case of?
What is the approximate ratio of the sales of nail enamels in 2000 to the sales of Talcum powders in 1995?

The sales have increase by nearly 55% from 1995 to 2000 in the case of?
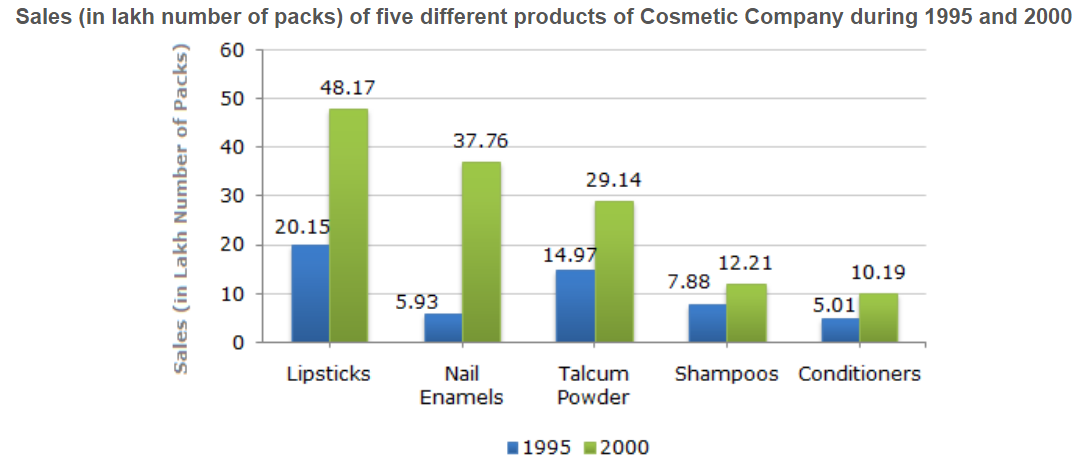
The sales of conditioners in 1995 was by what percent less than the sales of shampoos in 1995? (rounded off to nearest integer)

The total production of flovour Z in 1997 and 1998 is what percentage of the total production of flavour X in 1995 and 1996?

For which flavour was the average annual production maximum in the given period?
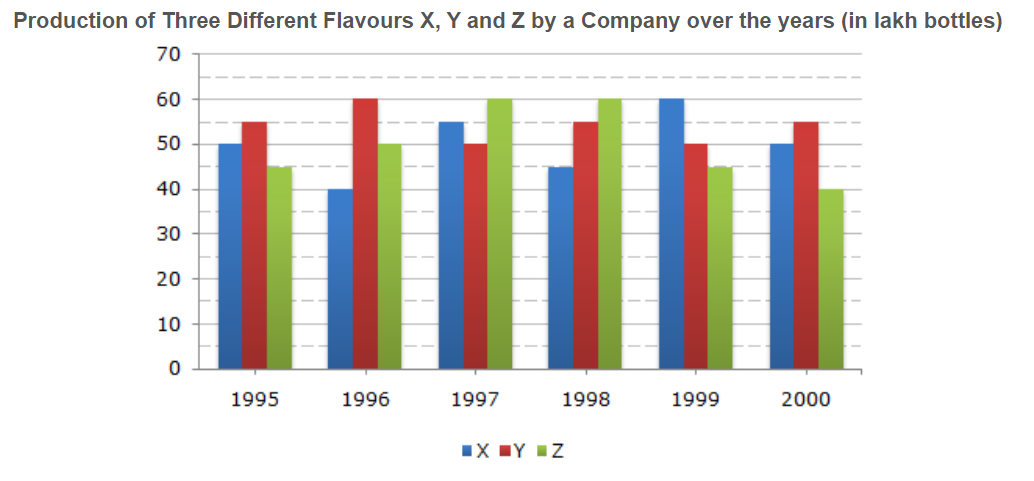
What is the difference between the average production of flavour X in 1995, 1996 and 1997 and the average production of flavour Y in 1998, 1999 and 2000?

What was the approximate decline in the production of flavour Z in 2000 as compared to the production in 1998?
