Bar Charts MCQs
Welcome to our comprehensive collection of Multiple Choice Questions (MCQs) on Bar Charts, a fundamental topic in the field of Data Interpretation. Whether you're preparing for competitive exams, honing your problem-solving skills, or simply looking to enhance your abilities in this field, our Bar Charts MCQs are designed to help you grasp the core concepts and excel in solving problems.
In this section, you'll find a wide range of Bar Charts mcq questions that explore various aspects of Bar Charts problems. Each MCQ is crafted to challenge your understanding of Bar Charts principles, enabling you to refine your problem-solving techniques. Whether you're a student aiming to ace Data Interpretation tests, a job seeker preparing for interviews, or someone simply interested in sharpening their skills, our Bar Charts MCQs are your pathway to success in mastering this essential Data Interpretation topic.
Note: Each of the following question comes with multiple answer choices. Select the most appropriate option and test your understanding of Bar Charts. You can click on an option to test your knowledge before viewing the solution for a MCQ. Happy learning!
So, are you ready to put your Bar Charts knowledge to the test? Let's get started with our carefully curated MCQs!
Bar Charts MCQs | Page 8 of 10
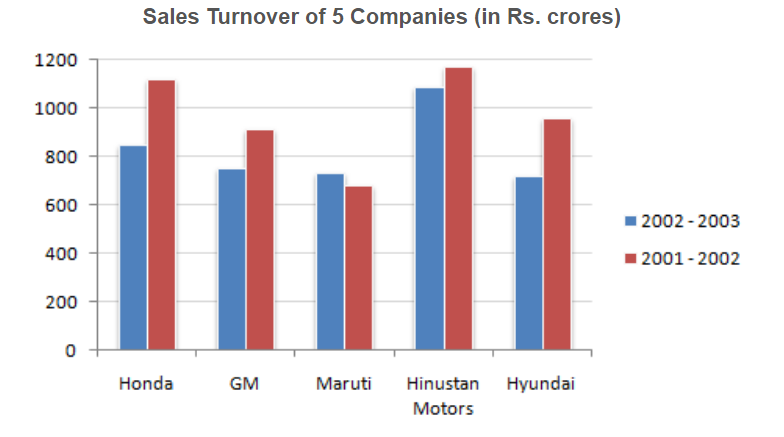
Which of the companies shows the maximum percentage difference in sales turnover between the two years ?

What should have been the sales turnover of GM in 2002 - 2003 to have shown an excess of the same quantum over 2001 - 2002 as shown by the sales turnover of Maruti ?

What is the approximate difference between the average sales turnover of all the companies put together between the years 2001 - 2002 and 2002 - 2003 ?
How many companies have shown production below their average production in 2002 - 2003, but have showed above the average production in 2003 - 2004 ?

The ratio of Hindustan Motors production in 2003 - 2004 to Honda's production in 2002 - 2003 is ?
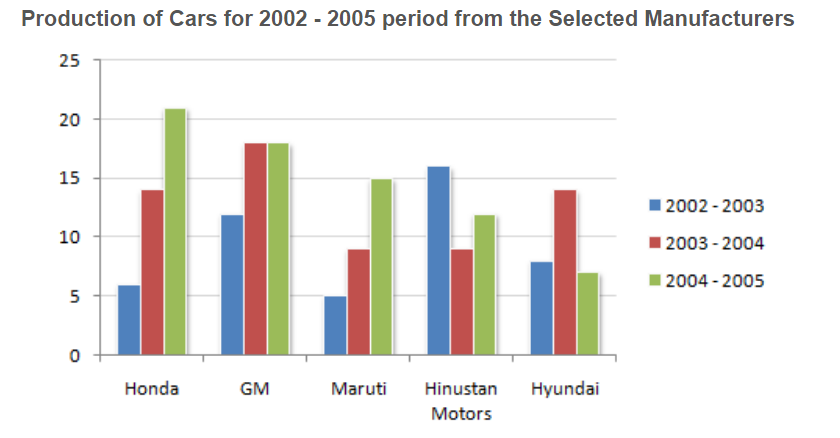
For how many companies has there been no decrease in production in any year from the previous year ?

The ratio between the difference between the highest and the lowest of the surplus countries to the difference between Bangladesh and Oman is ?
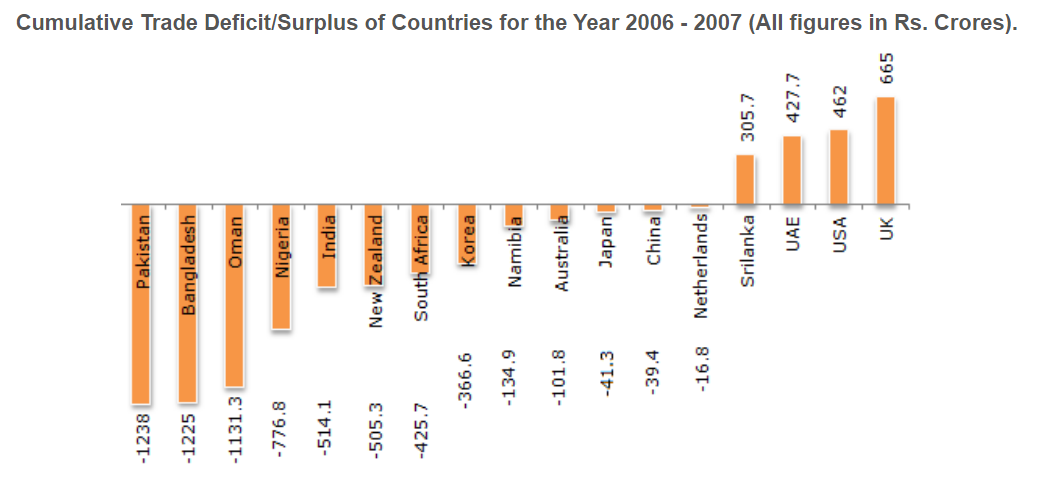
The average of the total deficit of the middle five deficit is closest to the deficit of which country ?

The state whose surplus is nearly equal to the average of the four surplus countries is

The ratio of the deficit of the first five deficit countries to the overall deficit of all the deficit countries is nearly equal to ?
