Bar Charts MCQs
Welcome to our comprehensive collection of Multiple Choice Questions (MCQs) on Bar Charts, a fundamental topic in the field of Data Interpretation. Whether you're preparing for competitive exams, honing your problem-solving skills, or simply looking to enhance your abilities in this field, our Bar Charts MCQs are designed to help you grasp the core concepts and excel in solving problems.
In this section, you'll find a wide range of Bar Charts mcq questions that explore various aspects of Bar Charts problems. Each MCQ is crafted to challenge your understanding of Bar Charts principles, enabling you to refine your problem-solving techniques. Whether you're a student aiming to ace Data Interpretation tests, a job seeker preparing for interviews, or someone simply interested in sharpening their skills, our Bar Charts MCQs are your pathway to success in mastering this essential Data Interpretation topic.
Note: Each of the following question comes with multiple answer choices. Select the most appropriate option and test your understanding of Bar Charts. You can click on an option to test your knowledge before viewing the solution for a MCQ. Happy learning!
So, are you ready to put your Bar Charts knowledge to the test? Let's get started with our carefully curated MCQs!
Bar Charts MCQs | Page 3 of 10
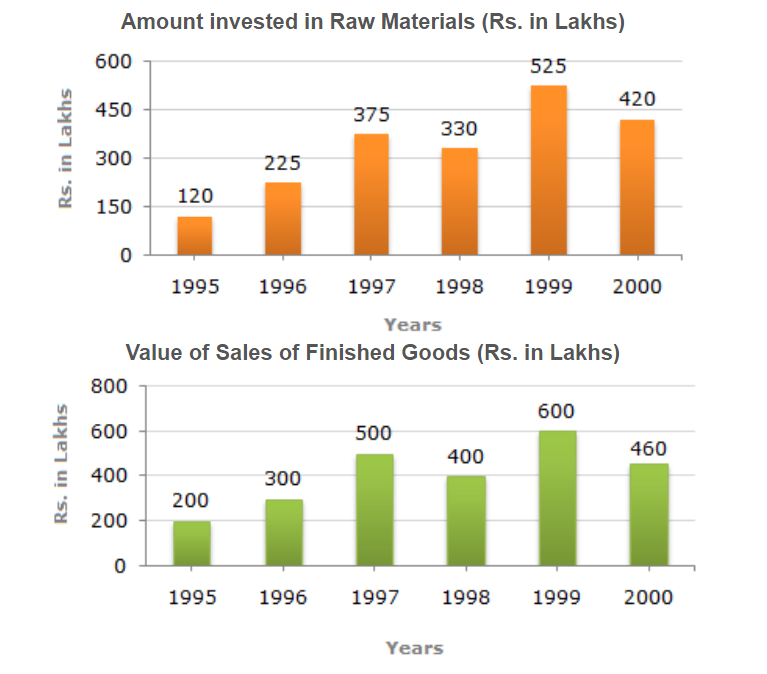
In which year, there has been a maximum percentage increase in the amount invested in Raw materials as compared to the previous year?
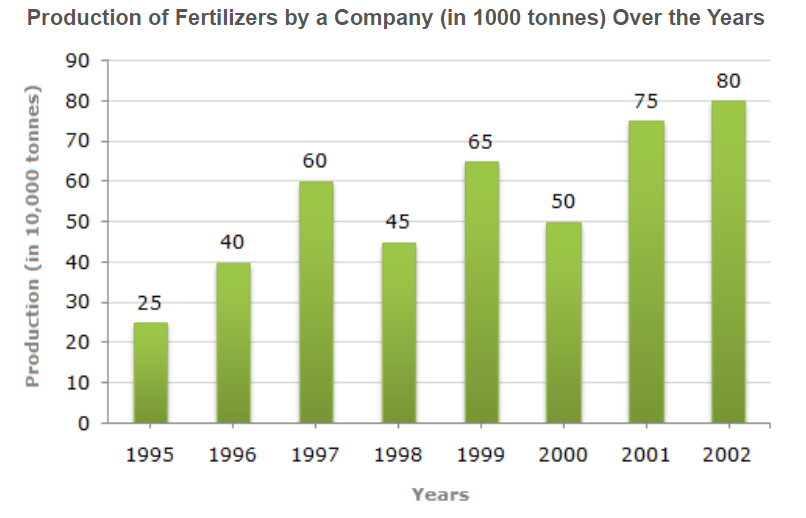
What was the percentage decline in the production of fertilizers from 1997 to 1998?

The average production of 1996 and 1997 was exactly equal to the average production of which of the following pairs of years?

What was the percentage increase in production of fertilizers in 2002 compared to that in 1995?

In which year was the percentage increase in production as compared to the previous year the maximum?

In how many of the given years was the production of fertilizers more than the average production of the given years?
The total amount of expenditures of the company is how many times of expenditure on research and development?
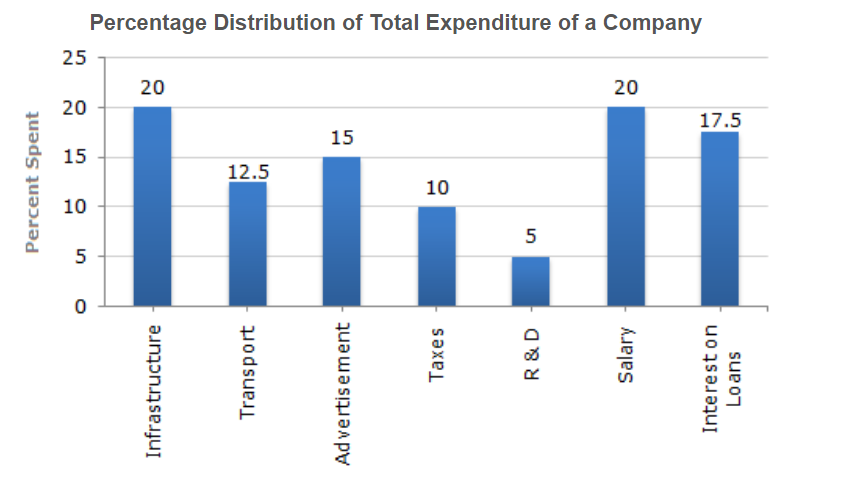
If the expenditure on advertisement is 2.10 crores then the difference between the expenditure on transport and taxes is?

What is the ratio of the total expenditure on infrastructure and transport to the total expenditure on taxes and interest on loans?

If the interest on loans amounted to Rs. 2.45 crores then the total amount of expenditure on advertisement, taxes and research and development is?
