Bar Charts MCQs
Welcome to our comprehensive collection of Multiple Choice Questions (MCQs) on Bar Charts, a fundamental topic in the field of Data Interpretation. Whether you're preparing for competitive exams, honing your problem-solving skills, or simply looking to enhance your abilities in this field, our Bar Charts MCQs are designed to help you grasp the core concepts and excel in solving problems.
In this section, you'll find a wide range of Bar Charts mcq questions that explore various aspects of Bar Charts problems. Each MCQ is crafted to challenge your understanding of Bar Charts principles, enabling you to refine your problem-solving techniques. Whether you're a student aiming to ace Data Interpretation tests, a job seeker preparing for interviews, or someone simply interested in sharpening their skills, our Bar Charts MCQs are your pathway to success in mastering this essential Data Interpretation topic.
Note: Each of the following question comes with multiple answer choices. Select the most appropriate option and test your understanding of Bar Charts. You can click on an option to test your knowledge before viewing the solution for a MCQ. Happy learning!
So, are you ready to put your Bar Charts knowledge to the test? Let's get started with our carefully curated MCQs!
Bar Charts MCQs | Page 9 of 10
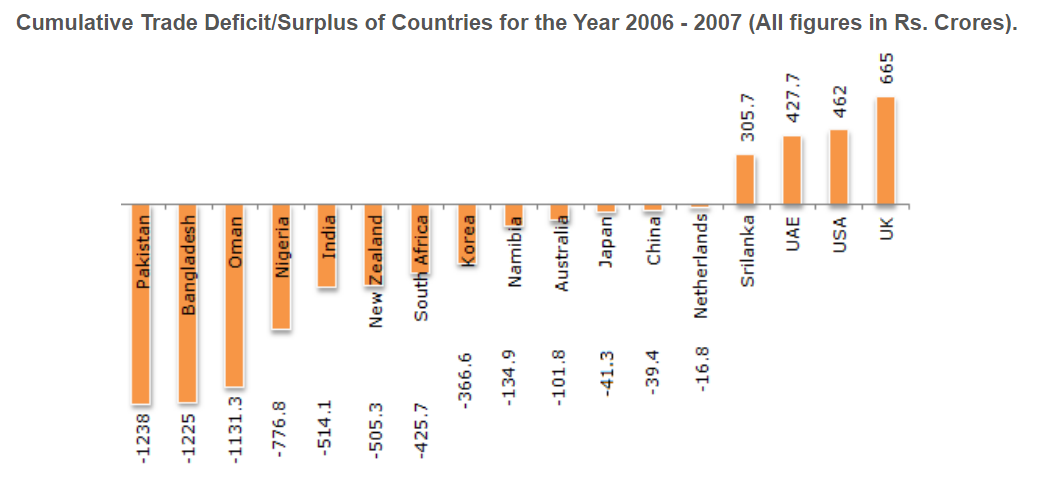
The net total deficit/surplus is equal to ?
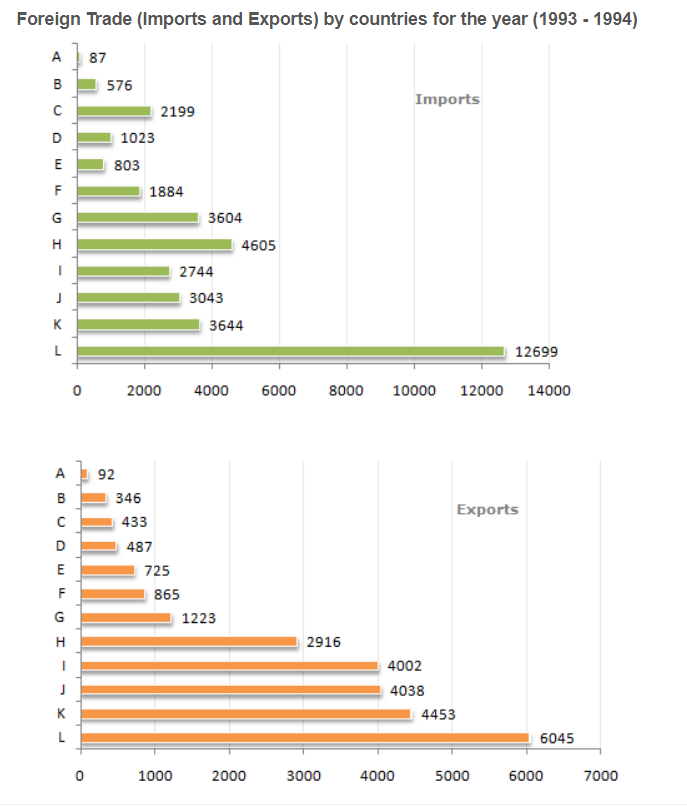
The ratio of the maximum exports to the minimum imports was closest to ?

How many countries exhibited a trade surplus ?

The total trade deficit/surplus for all the countries put together was ?

The highest trade deficit was shown by which country ?

The ratio of Exports to Imports was highest for which country ?
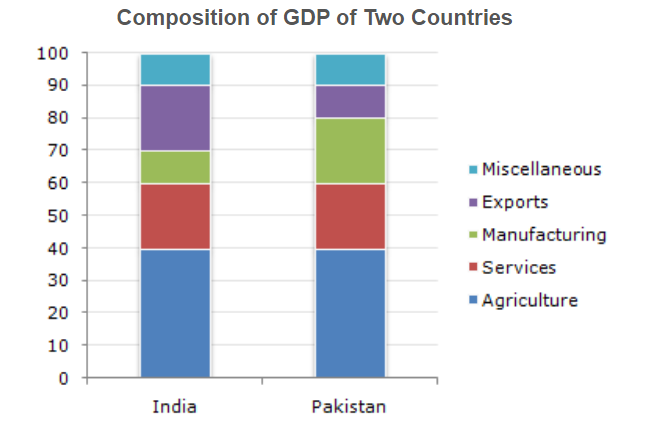
If the total GDP of Pakistan is Rs. 10,000 crore, then a GDP accounted for by Manufacturing is ?

What fraction of India's GDP is accounted for by Services ?

If the total GDP of India is Rs.30,000 crores, then the GDP accounted for by Agriculture, Services and Miscellaneous is ?

Which country accounts for higher earning out of Services and Miscellaneous together ?