Bar Charts MCQs
Welcome to our comprehensive collection of Multiple Choice Questions (MCQs) on Bar Charts, a fundamental topic in the field of Data Interpretation. Whether you're preparing for competitive exams, honing your problem-solving skills, or simply looking to enhance your abilities in this field, our Bar Charts MCQs are designed to help you grasp the core concepts and excel in solving problems.
In this section, you'll find a wide range of Bar Charts mcq questions that explore various aspects of Bar Charts problems. Each MCQ is crafted to challenge your understanding of Bar Charts principles, enabling you to refine your problem-solving techniques. Whether you're a student aiming to ace Data Interpretation tests, a job seeker preparing for interviews, or someone simply interested in sharpening their skills, our Bar Charts MCQs are your pathway to success in mastering this essential Data Interpretation topic.
Note: Each of the following question comes with multiple answer choices. Select the most appropriate option and test your understanding of Bar Charts. You can click on an option to test your knowledge before viewing the solution for a MCQ. Happy learning!
So, are you ready to put your Bar Charts knowledge to the test? Let's get started with our carefully curated MCQs!
Bar Charts MCQs | Page 7 of 10
Which of the countries listed below accounts for the maximum GDP during the half decade 2006 to 2010 ?

The GDP of UAE is what fraction of GDP of the UK for the decade (approximately) ?

Which of the countries listed below accounts for the highest GDP during the half decade 2001 to 2005 ?
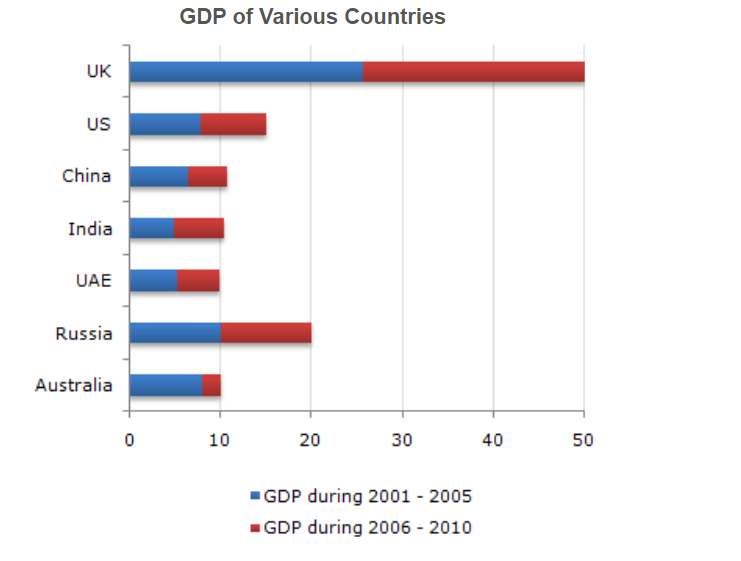
Out of every Rs. 10,000 spent during the decade 2001 - 2010 approximately how much was the GDP of Russia during the half decade 2001 - 2005 ?

Which year showed the best result in MBA entrance exams (in terms of percentage of students who cleared) ?

What was the percentage of students who succeeded in at least one of three exams in 2000 ?
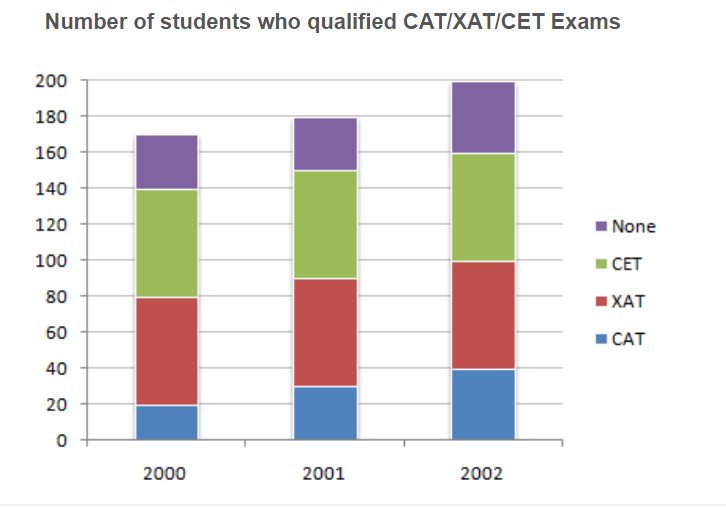
What is the percentage increase in the number of students in 2002 over 2000 ?

What is the percentage of students who cleared CAT in 2000 ?

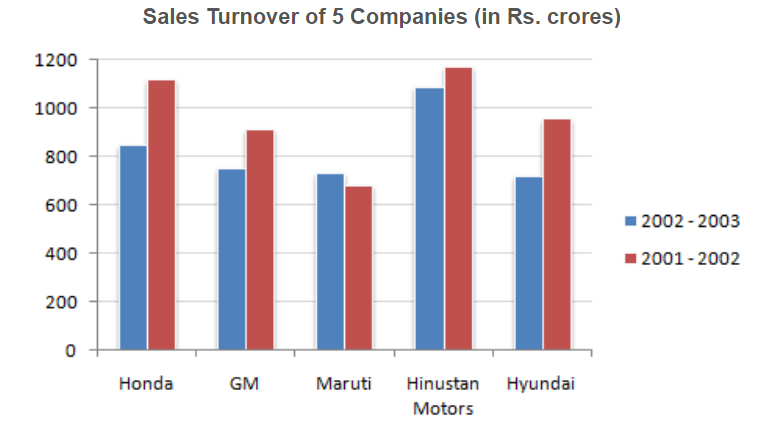
What is the percentage change in the overall sales turnover of the five companies together between 2001 - 2002 and 2002 - 2003 ?

What is the absolute change in overall sales turnover of the five companies together between 2001 - 2002 and 2002 - 2003 ?