Bar Charts MCQs
Welcome to our comprehensive collection of Multiple Choice Questions (MCQs) on Bar Charts, a fundamental topic in the field of Data Interpretation. Whether you're preparing for competitive exams, honing your problem-solving skills, or simply looking to enhance your abilities in this field, our Bar Charts MCQs are designed to help you grasp the core concepts and excel in solving problems.
In this section, you'll find a wide range of Bar Charts mcq questions that explore various aspects of Bar Charts problems. Each MCQ is crafted to challenge your understanding of Bar Charts principles, enabling you to refine your problem-solving techniques. Whether you're a student aiming to ace Data Interpretation tests, a job seeker preparing for interviews, or someone simply interested in sharpening their skills, our Bar Charts MCQs are your pathway to success in mastering this essential Data Interpretation topic.
Note: Each of the following question comes with multiple answer choices. Select the most appropriate option and test your understanding of Bar Charts. You can click on an option to test your knowledge before viewing the solution for a MCQ. Happy learning!
So, are you ready to put your Bar Charts knowledge to the test? Let's get started with our carefully curated MCQs!
Bar Charts MCQs | Page 5 of 10
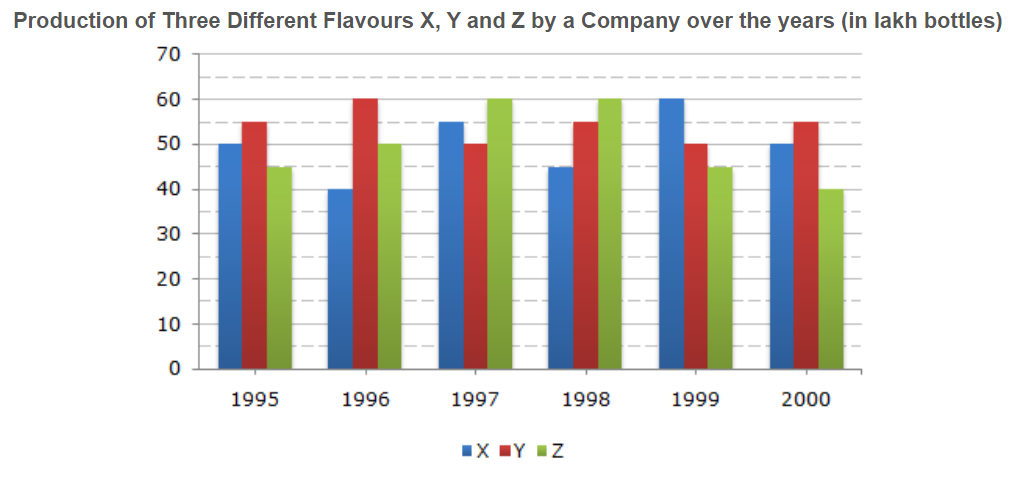
For which of the following years the percentage of rise/fall in production from the previous year is the maximum for the flavour Y?
What was the difference in the number of Q type cars produced in 2000 and that produced in 2001?
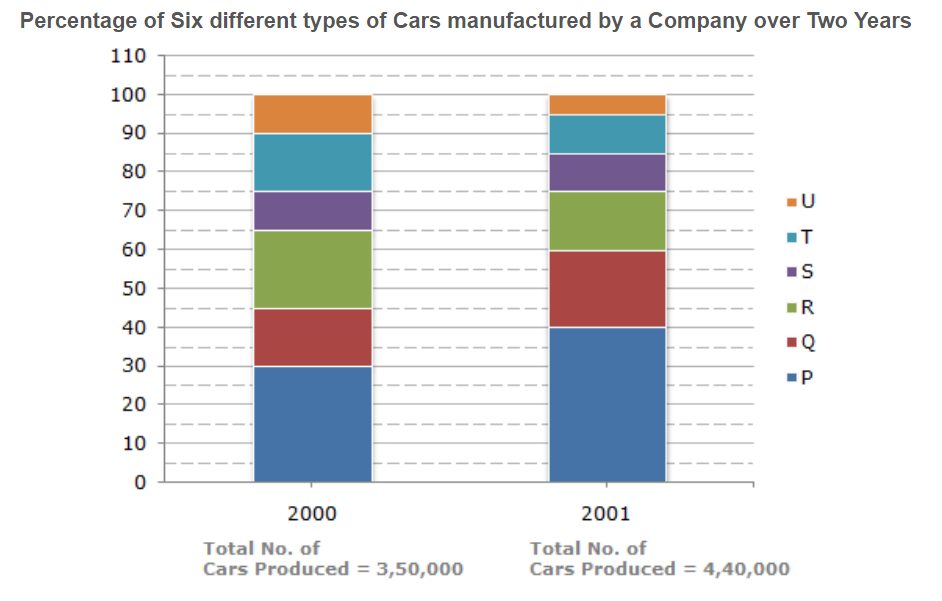
Total number of cars of models P, Q and T manufactured in 2000 is?

If the percentage production of P type cars in 2001 was the same as that in 2000, then the number of P type cars produced in 2001 would have been?

If 85% of the S type cars produced in each year were sold by the company, how many S type cars remain unsold?

For which model the percentage rise/fall in production from 2000 to 2001 was minimum?

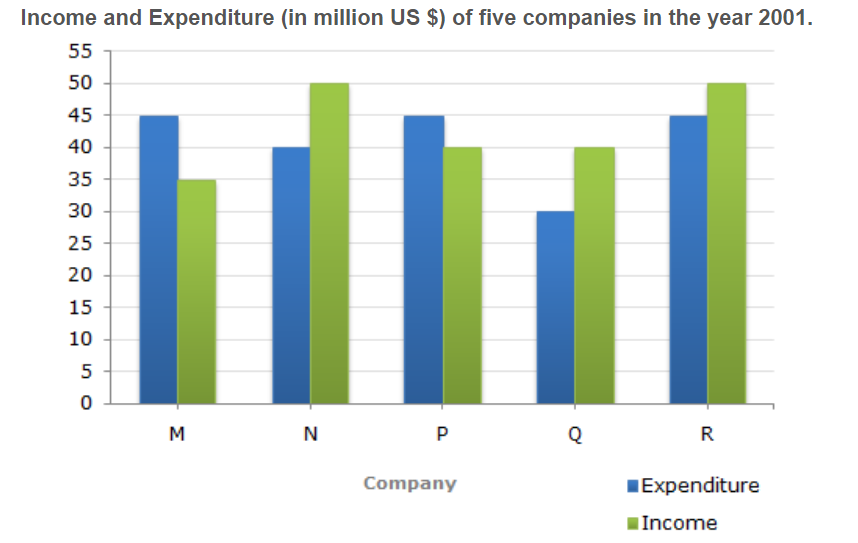
% Profit/Loss = (Income - Expenditure)/Expenditure x 100
The companies M and N together had a percentage of profit/loss of?

% Profit/Loss = (Income - Expenditure)/Expenditure x 100
In 2001, what was the approximate percentage of profit/loss of all the five Companies taken together?

% Profit/Loss = (Income - Expenditure)/Expenditure x 100
Which company earned the maximum percentage profit in the year 2001?

% Profit/Loss = (Income - Expenditure)/Expenditure x 100
For Company R, if the expenditure had increased by 20% in year 2001 from year 2000 and the company had earned profit of 10% in 2000, what was the Company's income in 2000 (in million US $)?